Differential Protein Expressions in Virus-Infected and Uninfected Trichomonas vaginalis
Article information
Abstract
Protozoan viruses may influence the function and pathogenicity of the protozoa. Trichomonas vaginalis is a parasitic protozoan that could contain a double stranded RNA (dsRNA) virus, T. vaginalis virus (TVV). However, there are few reports on the properties of the virus. To further determine variations in protein expression of T. vaginalis, we detected 2 strains of T. vaginalis; the virus-infected (V+) and uninfected (V−) isolates to examine differentially expressed proteins upon TVV infection. Using a stable isotope N-terminal labeling strategy (iTRAQ) on soluble fractions to analyze proteomes, we identified 293 proteins, of which 50 were altered in V+ compared with V− isolates. The results showed that the expression of 29 proteins was increased, and 21 proteins decreased in V+ isolates. These differentially expressed proteins can be classified into 4 categories: ribosomal proteins, metabolic enzymes, heat shock proteins, and putative uncharacterized proteins. Quantitative PCR was used to detect 4 metabolic processes proteins: glycogen phosphorylase, malate dehydrogenase, triosephosphate isomerase, and glucose-6-phosphate isomerase, which were differentially expressed in V+ and V− isolates. Our findings suggest that mRNA levels of these genes were consistent with protein expression levels. This study was the first which analyzed protein expression variations upon TVV infection. These observations will provide a basis for future studies concerning the possible roles of these proteins in host-parasite interactions.
INTRODUCTION
Trichomoniasis is a curable non-viral sexually-transmitted disease (STD) caused by the flagellate protozoan Trichomonas vaginalis [1]. It has been recognized as a cause of vaginitis and cervicitis in women, and asymptomatic urethritis and prostatitis in men [2]. In recent years, T. vaginalis infection is related to preterm-deliveries and stillbirth [3], increased transmission of human immunodeficiency virus type 1 (HIV-1) [4], and cervical cancers [5]. In addition, as one of the deep-branching eukaryotes, T. vaginalis may serve as an excellent biological model for examining the evolution of eukaryotes [6].
T. vaginalis virus (TVV), belonging to the field of protozoan viruses, is a non-segmented double-stranded (ds) RNA virus infecting only T. vaginalis [7,8]. In protozoan viruses, Giardia lamblia virus (GLV) may arrest the growth of G. lamblia [9]; Leishmania virus possibly cause differences in virulence and pathology [10]; Cryptosporidium parvum virus (CPV) is a target for sensitive detection of C. parvum oocysts in water [11]. Yet, little is understood of the TVV, there is a study that TVV infection affects the phenotypic variation of a prominent immunogen, P270 protein [12]. To increase our understanding of the influence of virus-infected T. vaginalis (V+), we analyzed the soluble proteins expressed by the virus-infected (V+) and uninfected (V−) isolates by quantitative proteomic analysis.
The iTRAQ labeling method was used for comparative proteomic analysis in Plasmodium berghei [13] and Giardia lamblia [14]. In this study, we utilized the iTRAQ labeling method to identify differentially expressed proteins in 2 strains (V+ and V− isolates) of T. vaginalis. These analyses will provide a useful basis for understanding the mechanisms involved in drug resistance, pathogenesis, and host-parasite interactions of T. vaginalis.
MATERIALS AND METHODS
Parasite culture
The V+ (GenBank accession no. DQ528812) [15] and V− isolates were isolated from clinical patients and cultured in our laboratory. The 2 stains were cultured in axenic TYM medium (pH 5.5) supplemented with 10% heat-inactivated calf serum at 37°C, as previously described [16]. Cultured parasites were harvested during the logarithmic phase of growth, washed with PBS (PBS; pH 7.4) and stored at −80°C.
Growth curve
In order to observe the growth of V+ and V−, an initial inoculum of 2×10⁵ trophozoites per ml was grown in TYM medium (1.5 ml final volume), using 24-well microtiter plates. Trophozoites were counted using a hemocytometer during 72 hr (at 0, 2, 4, 6, 12, 24, 48, and 72 hr). All tests were performed in triplicate. All data were analyzed with SPSS.
Protein extraction and trypsin digestion
The 2 strains of T. vaginalis, 1×10⁸ trophozoites were homogenized with liquid nitrogen, and the cold-acetone method was used to extract the total protein. After adding 10% trichloroacetic acid (TCA) in acetone to each sample, they were incubated at −20°C for 2 hr and then centrifuged (20,000 g, 30 min, 4°C). The pellet was washed with acetone to reduce acidity and centrifuged again (20,000 g, 30 min, 4°C). The wash step was repeated 3 times. The dried pellets were lysed with 1 ml of protein extraction buffer (8 M urea, 4% w/v CHAPS, 30 mM HEPES, 1 mM PMSF, 2 mM EDTA, and 10 mM DTT) and sonicated (2 sec sonication and 3 sec incubation on ice, at 180 W for 5 min). The resulting lysate was centrifuged (20,000 g, 4°C, 30 min) to remove non-soluble impurities. Protein concentrations were measured using the 2-D Quant Kit (Amersham Biosciences, Piscataway, New Jersey, USA) according to the manufacturer’s instructions and stored at −80°C for future use.
iTRAQ isobaric labeling
For iTRAQ analysis, 100 μg of each protein sample was denatured, and cysteines were blocked as described in the iTRAQ protocol (iTRAQ® Reagent-8Plex Multiplex Kit) (Applied Biosystems, Foster City, California, USA). The protein samples were then digested with 5 μg of sequence-grade modified trypsin (Promega, Madison, Wisconsin, USA) at 37°C for 36 hr. Digested samples were dried in a centrifuge vacuum concentrator, and the protein pellets dissolved in 30 μl of 50% TEAB (Sigma, St. Louis, Missouri, USA) with 70 μl of isopropanol, and labeled with iTRAQ reagents according to the manufacturer’s protocol. The trypsin-digested samples were analyzed using a MALDI TOF/TOF mass spectrometer to ensure complete digestion. During labeling, iTRAQ-114 (V+) and iTRAQ-121 (V−) samples were tagged with 2 different iTRAQ reagents following the manufacturer’s instructions. The iTRAQ-labeled samples were then pooled and subjected to strong cation exchange (SCX) fractionation.
SCX fractionation
Labeled samples were fractionated using a high performance liquid chromatography (HPLC) system (Shimadzu, Kyoto, Japan) connected to an SCX column (Luna 5u column, 4.6 mm internal diameter (I.D.)×250 mm, 5 μm, 100 Å; Phenomenex, Torrence, California, USA). The labeled peptides were eluted using buffer A [10 mM KH2PO4 in 25% acetonitrile (ACN), pH 3.0] and buffer B (2 M KCl, 10 mM KH2PO4 in 25% ACN, pH 3.0), and fractions were collected in 1.5-ml microcentrifuge tubes at a flow rate of 1 ml/min for 60 min. A 60 min gradient was applied: 30 min with 100% buffer A; 1 min with 5% buffer B; 15 min with 30% buffer B; 5 min with 50% buffer B; and 5 min with 100% buffer B. All solutions used were freshly prepared and filtered through a 0.22-μm pore membrane. Fraction collection commenced 31 min after injection, with fractions collected every 1 min to obtain a total of 38 fractions. For high salt concentration fractions, an additional step was used to remove the salt with a Strata-X 33u Polymeric Reversed Phase column (Phenomenex). Eluted fractions were dried in a vacuum concentrator, and each fraction was redissolved in 0.1% formic acid solution prior to reversed-phase nLC-tandem MS.
Reversed-phase nanoliquid chromatography/tandem MS (LC-MS/MS)
The equal amount of peptides in each fraction was injected into the nNano-liquid chromatography (Nano-LC) system. For analysis using MALDI-TOF/TOF, the SCX peptide fractions were pooled to reduce peptide complexity to yield 17 fractions. A 10-μl portion from each fraction was injected twice into the Proxeon Easy Nano-LC system (Thermo Scientific, West Palm Beach, Florida, USA). Peptides were separated on a C18 analytical reverse phase column at a flow rate of 300 nl/min with solvent (solution A, 5% CAN and 0.1% formic acid; solution B, 95% ACN and 0.1% formic acid) for 120 min. A linear LC gradient profile was used to elute peptides from the column, commencing with 5% solution B. After equilibration in 5% solution B, a multi-slope gradient started 10 min after the injection signal as follows: 45% solution B for 80 min; 80% solution B for 15 min; 5% solution B for 15 min; and then 5% solution B. Fractions were analyzed using a hybrid quadrupole/time-of-flight MS (Micro TOF-Q II; Bruker, Bremen, Germany) with nano electrospray ion source. Data were collected and analyzed using Data Analysis Software (Bruker). Nitrogen was used as the collision gas, and the MS/MS scans from 50–2,000 m/z were recorded. The ionization tip voltage and interface temperature were set at 1,250 V and 150°C, respectively.
Data analysis
All mass spectra data were collected using Bruker Daltonics micro TOF control, and processed and analyzed using Data Analysis Software. The Uniprot rat database was downloaded and integrated into the Mascot search engine (version 2.3.01) through the database maintenance unit. All parameters were set as follows: trypsin as the digestion enzyme; cysteine carbamidomethylation as fixed modification; iTRAQ 8Plex on N-terminal residue; iTRAQ 8Plex on tyrosine (Y); iTRAQ 8Plex on lysine (K); glutamine as pyroglutamic acid; and oxidation on methionine (M) as the variable modification. The tolerance settings for peptide identification in Mascot searches were 0.05 Da for MS and 0.05 Da for MS/MS. Mascot search results were normalized and quantified using Scaffold Software (version 3.0).
Relative real-time quantitative PCR
To examine the mRNA levels in the V+ and V− strains, total RNA was extracted with a Protein and RNA Extraction KitTM (TaKaRa, Shiga, Japan). Four differentially expressed genes encoding the following proteins were chosen: glycogen phosphorylase (AY050312.1), malate dehydrogenase (TVAG_204360), triosephosphate isomerase (TVAG_497370), and glucose-6-phosphate isomerase (AF425240.1). For relative real-time quantitative (RQ) PCR, glyceraldehyde 3-phosphate dehydrogenase (GAPDH) (GenBank no. L11394.1), a housekeeping gene of Trichomonas vaginalis was used as the internal standard. The primers used in quantitative real-time PCR were listed in Table 1. All tests were performed in triplicate in the same run. Data analysis was carried out using ABIprism 7000 SDS software (version 1.2.3). The results were expressed as the ratio between the 4 above-mentioned proteins mRNA and GAPDH mRNA in the samples.
RESULTS
Growth curve
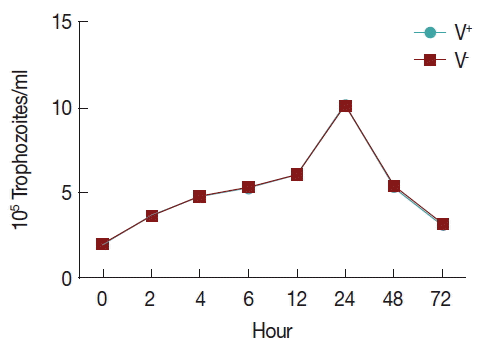
To observe the growth of T. vaginalis V+ and V− strains, an initial inoculum of 2×10⁵ per ml trophozoites were cultured in 24-well microtiter plates with 1.5 ml TYM medium, counting of parasites using a hemocytometer during 72 hr (at 0, 2, 4, 6, 12, 24, 48, and 72 hr). Trophozoite growth reached the highest density in 24 hr and decreasing after 72 hr of incubation, and no significant difference was found between the 2 strains (Fig. 1).
Identification of proteins by iTRAQ
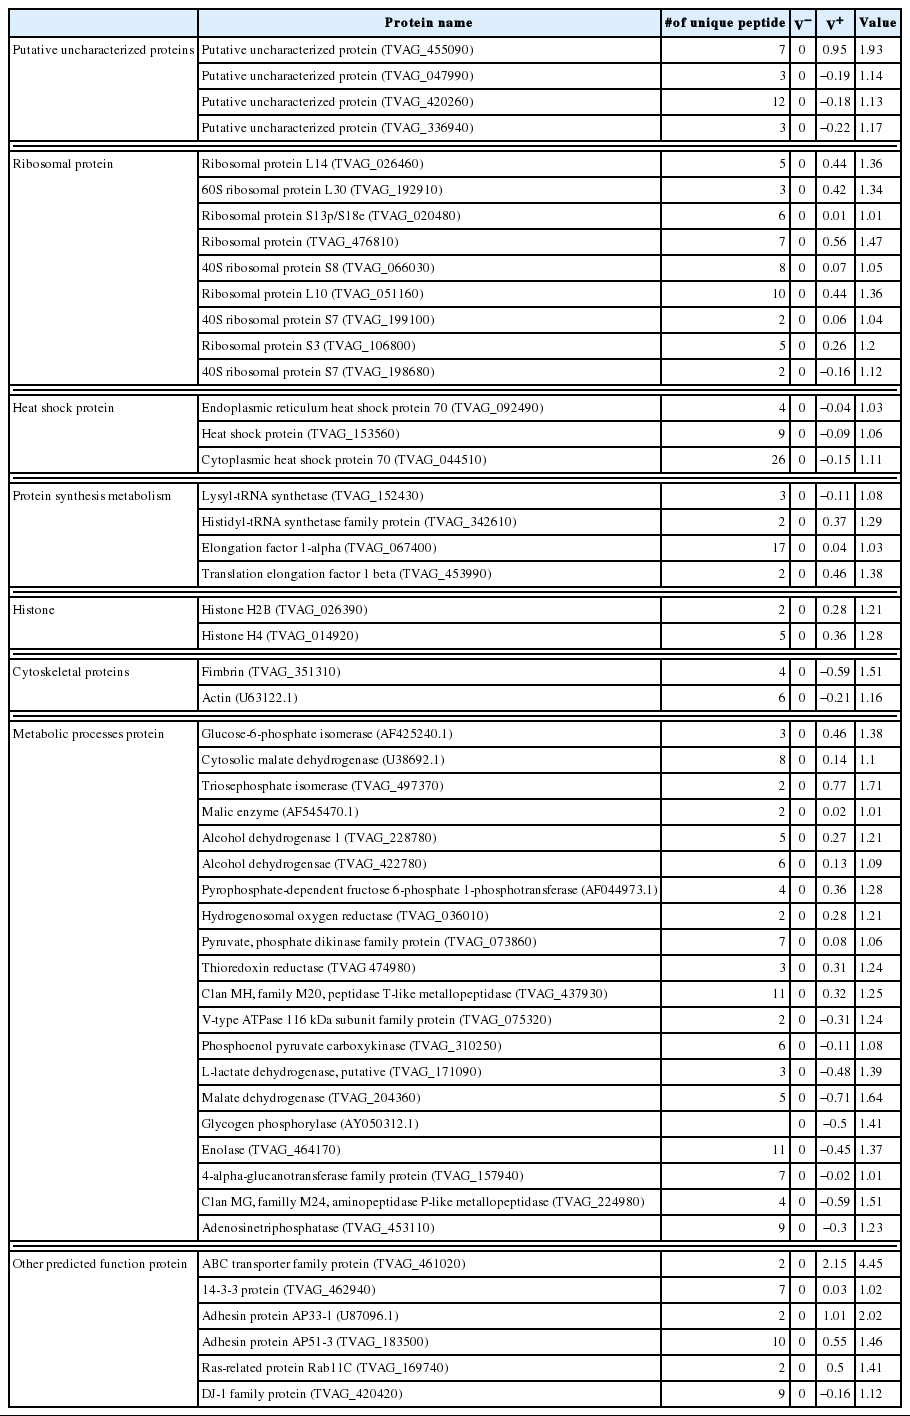
With respect to cultivation of the V+ and V− isolates, we did not observe significant differences using microscopy. To identify the variation in levels of expressed proteins between isolates, proteins were labeled with iTRAQ reagents. This analysis revealed that 293 proteins were expressed, with at least 2 peptides identified. The expression value of the proteins for the V− isolate was considered to be zero, while V+ isolate proteins expressed at levels 1-fold higher or lower were considered to be differentially expressed. Of 293 proteins, 50 were differentially expressed, with 21 down-regulated and the remainder up-regulated upon TVV infection.
Among these proteins, 4 were putative and previously uncharacterized. One of these uncharacterized proteins was found to be up-regulated upon TVV infection, and the remaining 3 were down-regulated. Total 9 ribosomal proteins showed increased expression levels in V+ isolates. The expression of 3 heat shock proteins was decreased. Proteins associated with metabolism, such as elongation factor-1α, histidyl-tRNA synthetases, and translation elongation factor-1β, were up-regulated. Histones H2B and H4 were up-regulated, while actin and fimbrin were downregulated. Twenty metabolic enzymes, particularly in carbohydrate metabolism (Fig. 2), and other proteins were also differentially expressed. All the results are listed in Table 2.

Differential expression of enzymes involved in glycolytic pathways between V+ and V− isolates of T. vaginalis. The highlight parts represent the changed expression proteins.
Relative real-time quantitative PCR
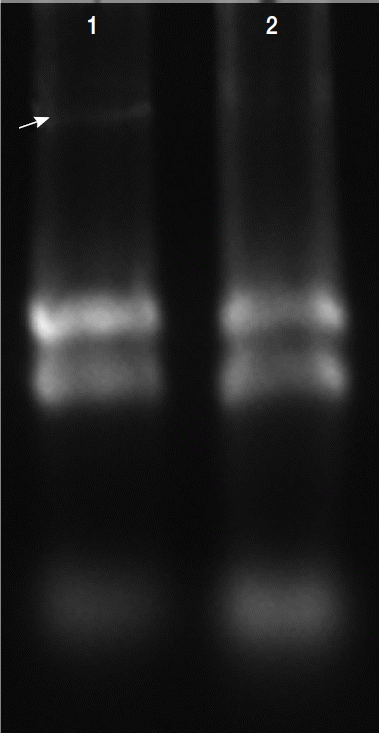
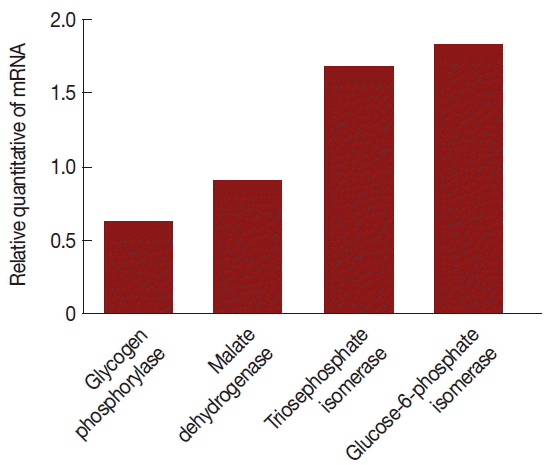
Total RNAs were extracted with protein and RNA extraction KitTM (Takara) from the virus-infected (V+) and uninfected (V−) isolates (Fig. 3). To elucidate the levels of mRNA expression in the V+ and V− isolates, the relative quantities between 4 of glycolytic pathway proteins and GAPDH mRNA were assayed by relative real-time quantitative PCR and expressed as the ratio between the 4 above-mentioned proteins and GAPDH mRNA (Fig. 4).

Total RNAs extracted in T. vaginalis. Total RNAs were extracted from the virus-infected (V+) and uninfected (V−) isolates, virus-infected isolate showed obvious viral band (arrow) compared with virus-uninfected isolate (lane 2).

Comparison of mRNA levels between uninfected and TVV-infected T. vaginalis strains. Glycogen phosphorylase and malate dehydrogenase mRNA expressions were significantly lower in the V+ isolate relative to the V− isolate. Triosephosphate isomerase and glucose-6-phosphate isomerase mRNA expressions were significantly increased in the V+ isolate relative to the V− isolate.
The mRNA expression levels were significantly different between V+ and V− isolates. The level of glycogen phosphorylase mRNA and malate dehydrogenase mRNA expression were decreased 39% and 11% (the ratios were 1.31 and 1.07), respectively, triosephosphate isomerase and glucose-6-phosphate isomerase were increased 67% and 82% (the ratios were 1.59 and 1.77), respectively, in the V+ T. vaginalis isolate relative to the V− T. vaginalis isolate. Hence, upon TVV infection, some of the proteins and their mRNA expressions were changed.
DISCUSSION
Numerous protozoa could be infected by virus, which may be involved in the function and pathogenicity of these protozoa [9–11]. More than 50% of T. vaginalis strains are infected with TVV, yet little is understood on the viruses which infect these protozoa. Previous studies have indicated that virus infection could influence surface expression of phenotypic characteristics of the host cells and alter the virulence of trichomonads [12,17–19]. To the best of our knowledge, this is the first proteomics investigation of T. vaginalis. We identified 293 T. vaginalis proteins, 50 of which were differentially expression between V+ and V− isolates. These proteins were divided into 4 categories; ribosomal proteins, metabolic enzymes, heat shock proteins, and putative uncharacterized proteins. These proteins were involved in different aspects of T. vaginalis infection.
The mechanisms of clinical metronidazole resistance in T. vaginalis are currently unclear, despite previous studies which showed differential expression of various proteins, including down-regulation of flavin reductase, alcohol dehydrogenase-1, hydrogenosomal oxygen reductase, and thioredoxin reductase [20], and up-regulation of lactate dehydrogenase [21]. In this study, by comparison with an uninfected T. vaginalis strain, TVV-infected T. vaginalis (V+) showed significant down-regulation of alcohol dehydrogenase-1, hydrogenosomal oxygen reductase, and thioredoxin reductase. The expression of L-lactate dehydrogenase in V− isolates was up-regulated. These data were consistent with previous studies and might explain the reason why uninfected T. vaginalis strain can be drug-resistant [22]. Conversely, T. vaginalis strains infected with TVV are more likely to be sensitive to metronidazole. Additionally, the ABC transporter family protein, containing a Fe-S binding site [23], plays a key role in multidrug resistance of cancer and yeast cells. It was likely involved in drug resistance of various pathogenic protozoa [24]. However, it was shown to be up-regulated in V+ isolate. Thus, to clarify the association of TVV with the drug resistance in T. vaginalis, further studies are required.
About pathogenicity, we confirmed the up-regulation of adhesin proteins, AP33-1 and AP51-3 in virus-infected T. vaginalis. These proteins bind to the surface of vaginal epithelial cells and are implicated in cell adhesion and host cell invasion [25–27]. It was previously suggested that virus infection might increase the pathogenicity of T. vaginalis [17,18]. In a previous study, virus infection regulated the surface immunogen P270, which influenced the pathogenicity of T. vaginalis. However, using iTRAQ reagents, we could not detect P270 in either V+ or V− isolates. This was likely due to its low abundance.
Despite the frequent occurrence of virus infections in T. vaginalis, the molecular mechanisms of infection remain largely unknown. We identified 50 proteins in T. vaginalis that were affected by TVV infection. These proteins were associated with various functions, including gene transcription and expression (e.g., ABC EI protein) [23], RNA packaging of HIV-1 genomic RNA into nascent virions and association with RNA polymerase of vesicular stomatitis virus (e.g., elongation factor 1-α (EF1α) [28,29], and monoubiquitination of histone H2B [30]. All of these proteins were found to be up-regulated in the V+ isolate compared with the V− isolate. However, further studies are needed to show whether these proteins participate in the virus life cycle.
Heat shock proteins (Hsps) are important molecular chaperones that participate in protein translation, folding, and trafficking [31]. Some reports have found that Hsp70 is induced by virus infection in animal and plant cells [32]. Using the iTRAQ method, we observed that 3 Hsps were down-regulated in the V+ isolate. Although the reason for this was unclear, it is probably an indicator that TVV protein translation requires the presence of the aforementioned Hsps, especially Hsp70.
According to data analysis, there were 10 differential expression enzymes in glycolytic pathways; therefore, we applied qPCR assays to analyze the expression of genes encoding glycogen phosphorylase, malate dehydrogenase, triosephosphate isomerase, and glucose-6-phosphate isomerase to detect variation of mRNA levels. Our findings indicate that mRNA production was altered; therefore, virus infection likely influenced the transcription level of T. vaginalis genes.
In summary, we have conducted the first major proteomics investigation of T. vaginalis. We screened the expression levels of proteins in uninfected and TVV-infected T. vaginalis strains, and found 50 differentially expressed proteins. Our results could facilitate further studies for the mechanisms of drug resistance and the virulence of TVV.
ACKNOWLEDGMENTS
This work was supported by the National Natural Science Foundation of China (no. 30300260). We declare that the experiments comply with the current laws of China where they were performed.
Notes
CONFLICT OF INTEREST
We have no conflict of interest related to this work.


