Abstract
Dense granule protein 16 (GRA16), an effector protein from Toxoplasma gondii, has been reported to enhance antitumor responses in several malignancies. However, whether GRA16 can enhance the inhibitory effects of standard anticancer drugs across diverse cancer types remains unclear. Gemcitabine, oxaliplatin, and irinotecan continue to play a key role in clinical oncology; however, their efficacy is limited by persistent tumor survival-promoting pathways. In this study, we stably expressed GRA16 in HepG2, PANC-1, and HCT116 cells and evaluated their responses to gemcitabine, oxaliplatin, and irinotecan under 50% inhibitory concentration-normalized dosing conditions. In vector control cells, baseline drug sensitivity was quantified using the CCK-8 assay across 0–64 μM after 48 h of exposure, and 50% inhibitory concentration was determined for each drug and cell line. Time-dependent proliferation assays (0–72 h) demonstrated that GRA16 reduced the basal growth rate and enhanced the growth inhibitory effects of all 3 drugs in all 3 cell models. Representative microscopy images at 48 h were consistent with reduced cell density in GRA16-expressing cultures under each treatment condition. These in vitro data indicate that GRA16 enhances the inhibitory effects of standard chemotherapeutic agents in hepatic, pancreatic, and colorectal cancer cell lines. This study provides a cross-cancer, multi-drug evaluation of GRA16-associated enhancement of drug response and includes, to our knowledge, the first assessment in a pancreatic cancer model. The underlying mechanism may involve pathway modulation, as suggested by previous studies and supported by the pancreatic cancer model, although it was not comprehensively examined across all cell lines.
-
Key words: Toxoplasma gondii, GRA16, drug response, gemcitabine, oxaliplatin, irinotecan
Gemcitabine, oxaliplatin, and irinotecan are widely used chemotherapeutic agents in clinical oncology that exert cytotoxic effects primarily through DNA damage or topoisomerase I (Topo-I) inhibition [
1-
4]. However, their clinical activity is often constrained by persistent tumor cell survival signaling, which can drive the development of chemoresistance. Gemcitabine resistance has been associated with activation of the phosphoinositide 3-kinase/protein kinase B (PI3K/AKT) and dysregulation of extracellular signal-regulated kinase (ERK) signaling [
1]. Oxaliplatin resistance has similarly been associated with PI3K/AKT signaling, and pharmacologic inhibition of this pathway can restore drug responsiveness [
2]. Irinotecan resistance has been linked to pro-survival nuclear factor-κB (NF-κB) and ERK signaling, and targeting these pathways can enhance the efficacy of SN38/irinotecan [
3,
4]. Collectively, these findings highlight the need for agents that can inhibit survival pathways to enhance the inhibitory response to chemotherapeutic treatment. To explore this concept in a relevant in vitro setting, we focused on liver (HepG2), pancreatic (PANC-1), and colorectal (HCT116) cancer cell lines, which are widely used in studies of anticancer drug responses [
5-
8].
Dense granule protein 16 (GRA16), an effector protein from
Toxoplasma gondii, has demonstrated anticancer activity across multiple malignancies, including hepatocellular carcinoma, non-small cell lung cancer, and colorectal cancer, and has been shown to enhance chemotherapeutic response in some cancer cell types [
9-
12]. Importantly, GRA16 activates convergent mechanisms that inhibit critical pro-survival signaling pathways implicated in chemotherapy resistance [
10,
12]. In hepatocellular carcinoma models, GRA16 induces apoptosis by enhancing the nuclear localization of phosphatase and tensin homolog (PTEN) and suppressing AKT signaling [
9]. In non-small cell lung cancer, GRA16 enhances irinotecan efficacy by upregulating protein phosphatase 2A, B55 regulatory subunit (PP2A-B55), suppressing AKT and ERK signaling, and inactivating NF-κB [
10]. In colon cancer cells, GRA16 inhibits cell growth by suppressing the PTEN/AKT/telomerase reverse transcriptase (TERT) axis and downregulating c-Myc/TERT-induced glycolysis [
11,
12]. These pathways intersect with survival signaling linked to resistance against gemcitabine, oxaliplatin, and irinotecan, providing a rationale to test whether GRA16 can enhance inhibitory responses to chemotherapeutic agents across different tumor types. Accordingly, we hypothesized that GRA16 enhances the inhibitory response of hepatocellular, pancreatic, and colorectal cancer cells to standard chemotherapeutic agents (DNA-damaging drugs and a Topo-I inhibitor) and evaluated whether stable GRA16 expression amplifies the growth-inhibitory effects of gemcitabine, oxaliplatin, and irinotecan under 50% inhibitory concentration (IC
50)-normalized dosing in HepG2, PANC-1, and HCT116 cells. In addition, this study was designed to determine whether GRA16-associated enhancement of inhibitory drug effects could be observed across multiple cancer types and multiple clinically relevant drugs, including a pancreatic cancer model that has not previously been evaluated in this context.
To test this hypothesis, GRA16 from the T. gondii RH strain (ATCC) was cloned into a lentiviral expression vector and introduced into HepG2 (KCLB), PANC-1 (KCLB), and HCT116 (KCLB) cells by lentiviral transduction to generate stable cell populations. Recombinant lentiviral particles were produced in Lenti-X 293T (Takara) cells using packaging and envelope plasmids, and target cells were transduced in the presence of polybrene (Santa Cruz Biotechnology). For both the empty vector and GRA16 constructs, GFP-positive transduced populations were enriched by flow-cytometric sorting based on GFP fluorescence using a SH800S cell sorter (Sony Biotechnology), and the sorted stable cell populations were used for subsequent assays. A lentiviral system was selected rather than transient transfection because this study required consistent construct expression across multiple downstream assays, extended incubation periods, and repeated drug-treatment conditions.
To validate construct expression at the mRNA level, total RNA was extracted from HepG2, PANC-1, and HCT116 vector and GRA16-expressing stable cell populations using the HiGene Total RNA Prep Kit (Biofact), and cDNA was synthesized using a Reverse-Transcription Premix (Elpis Biotech). PCR was performed using primers targeting vector-derived GFP (Vp) or GRA16 (Gp) under the following conditions: 95°C for 5 min; 35 cycles of 95°C for 30 sec, 58°C for 40 sec, and 72°C for 1.5 min; followed by 72°C for 3 min. The Vp primer sequences were 5′-AAG TTC ACC TTG ATG CCG TT-3′ (forward) and 5′-TGA AGT TCA TCT GCA CCA CC-3′ (reverse). The Gp primer sequences were 5′-GGG ATT GAG TGG AAC GAA GG-3′ (forward) and 5′-AAG TGC TAG AGT CGT CCA CA-3′ (reverse).
Cell viability was quantified using CCK-8 (Dojindo) after gemcitabine (Selleckchem), oxaliplatin (Selleckchem), and irinotecan (Selleckchem) treatment at concentrations ranging from 0 to 64 μM for 48 h.
The IC
50 was subsequently determined by linear interpolation using the 2 adjacent drug concentrations that directly bracketed 50% cell viability, allowing assessment of baseline drug sensitivity in vector cells for each cancer type (
Fig. 1). Specifically, if A and B represent the lower and higher concentrations bracketing 50% viability, and C and D represent the corresponding viability values at A and B, IC
50 was calculated as: IC
50=A+[(50−C)/(D−C)]×(B−A). This approach provided a transparent estimate of the concentration corresponding to 50% inhibition within the tested concentration range and was used to define normalized treatment concentrations for subsequent cross-cell-line comparisons. These IC
50 values were then used as normalized treatment concentrations for subsequent time-course cell proliferation analyses at 0, 24, 48, and 72 h (
Fig. 2). IC
50-based normalization adjusts drug exposure to reflect the distinct drug sensitivities of each cell line and allows comparison at a similar inhibition level.
For mechanistic validation, PANC-1 vector and GRA16-expressing cells were left untreated or treated with gemcitabine, oxaliplatin, or irinotecan for 24 h. Protein lysates were subjected to Western blot analysis to evaluate p-AKT/AKT, p-NF-κB/NF-κB, and p-ERK/ERK expression. Details of the primary and secondary antibodies used for Western blotting are provided in
Supplementary Table S1. Relative band intensities were quantified and compared between vector and GRA16 groups under each treatment condition.
For apoptosis analysis, PANC-1 vector and GRA16-expressing cells were left untreated or treated with gemcitabine, oxaliplatin, or irinotecan for 24 h, followed by staining with the Annexin V Apoptosis Detection Kit with 7-AAD (BioLegend). Stained cells were analyzed using a BD FACSCanto II flow cytometer (BD Biosciences). Total apoptotic cells were calculated as the sum of early and late apoptotic populations.
All statistical analyses were performed using GraphPad Prism 8 (GraphPad Software). For
Fig. 1, concentration-dependent viability data were analyzed using one-way ANOVA followed by Dunnett’s multiple comparisons test, with the untreated group (0 μM) used as the control. For
Fig. 2, time-course proliferation and viability data were analyzed separately using two-way ANOVA followed by Šídák’s multiple comparisons test, with comparisons made between the Vector and GRA16 groups at each corresponding time point. For
Fig. 3, Western blot quantification data were analyzed using two-way ANOVA followed by Holm–Šídák’s multiple comparisons test, whereas apoptosis/cell-death-associated population data were analyzed using two-way ANOVA followed by Šídák’s multiple comparisons test. In both analyses, comparisons were made between the Vector and GRA16 groups within each treatment condition. A
P-value <0.05 was considered statistically significant. Unless otherwise indicated, the reported n-values represent independent biological replicates derived from separately cultured dishes.
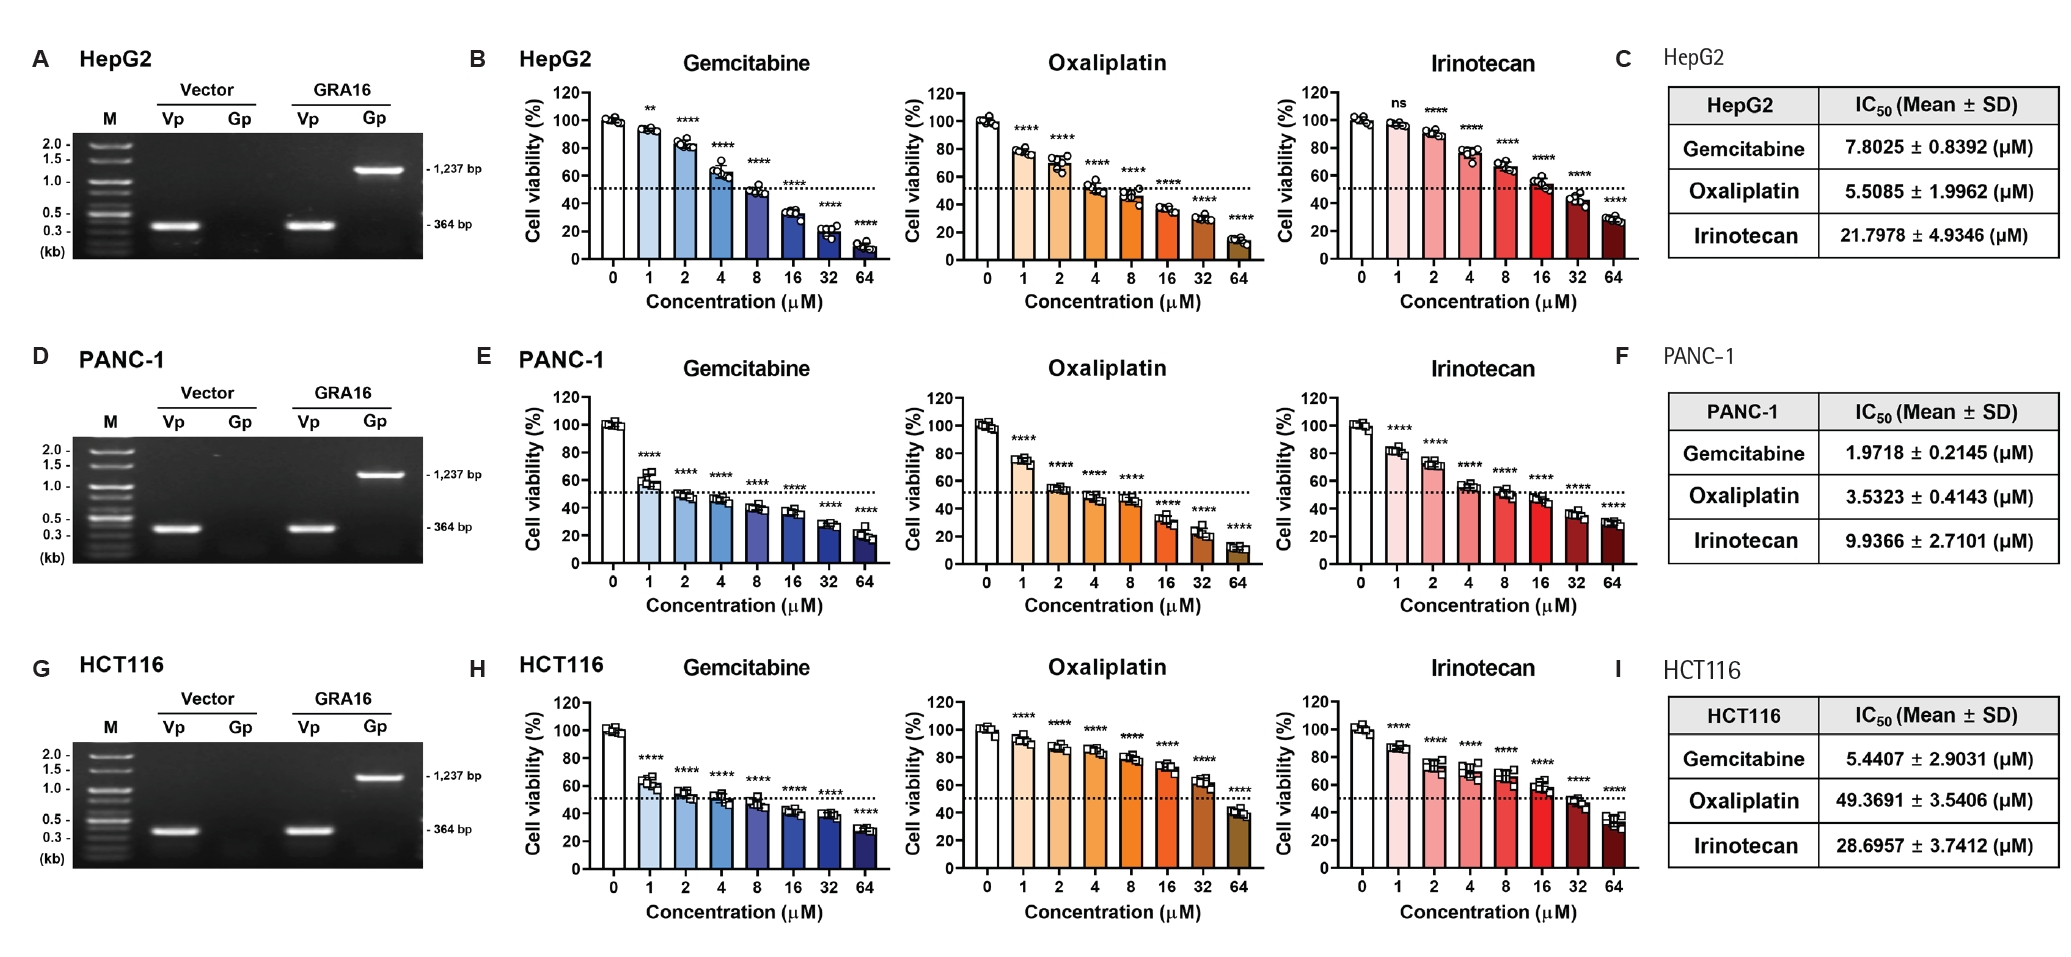
Prior to functional analyses, expression of the introduced constructs was verified at the mRNA level by RT-PCR in HepG2, PANC-1, and HCT116 stable cell populations (
Fig. 1A,
D,
G). In vector cells, only the GFP-target band (364 bp) was detected, whereas GRA16-expressing cells showed both the GFP-target band (364 bp) and the GRA16-target band (1,237 bp). These results confirmed successful expression of the introduced constructs in the stable cell populations used for subsequent experiments. Using these validated cell populations, we next assessed baseline chemotherapy sensitivity profiles in the 3 cell lines. HepG2 vector cells displayed IC
50 values of 7.8025 μM for gemcitabine, 5.5085 μM for oxaliplatin, and 21.7978 μM for irinotecan (
Fig. 1B,
C). PANC-1 cells were more sensitive to gemcitabine (IC
50=1.9718 μM) and oxaliplatin (IC
50=3.5323 μM), whereas the IC
50 for irinotecan was 9.9366 μM (
Fig. 1E,
F). HCT116 cells exhibited comparatively high resistance to oxaliplatin and irinotecan, with IC
50 values of 5.4407 μM for gemcitabine, 49.3691 μM for oxaliplatin, and 28.6957 μM for irinotecan (
Fig. 1H,
I).
In a drug-by-drug comparison within cell lines, HepG2 exhibited a high relative resistance to irinotecan, with oxaliplatin (5.5085 μM) < gemcitabine (7.8025 μM) < irinotecan (21.7978 μM) (
Fig. 1C). PANC-1 cells were relatively sensitive to all 3 drugs, with gemcitabine (1.9718 μM) < oxaliplatin (3.5323 μM) < irinotecan (9.9366 μM), and demonstrated a notably strong response to gemcitabine (
Fig. 1F). HCT116 exhibited selective resistance to oxaliplatin, with gemcitabine (5.4407 μM) < irinotecan (28.6957 μM) < oxaliplatin (49.3691 μM) (
Fig. 1I). In a cross-drug comparison of cell lines, PANC-1 cells were most sensitive to both gemcitabine and irinotecan (
Fig. 1C), whereas HCT116 cells were significantly resistant to oxaliplatin (
Fig. 1I). These results quantitatively illustrate the significant heterogeneity in sensitivity across cell lines and drug combinations.
The previously identified IC
50 values for each anticancer drug were used as normalized treatment concentrations for comparative inhibitory-response analysis. Using these IC
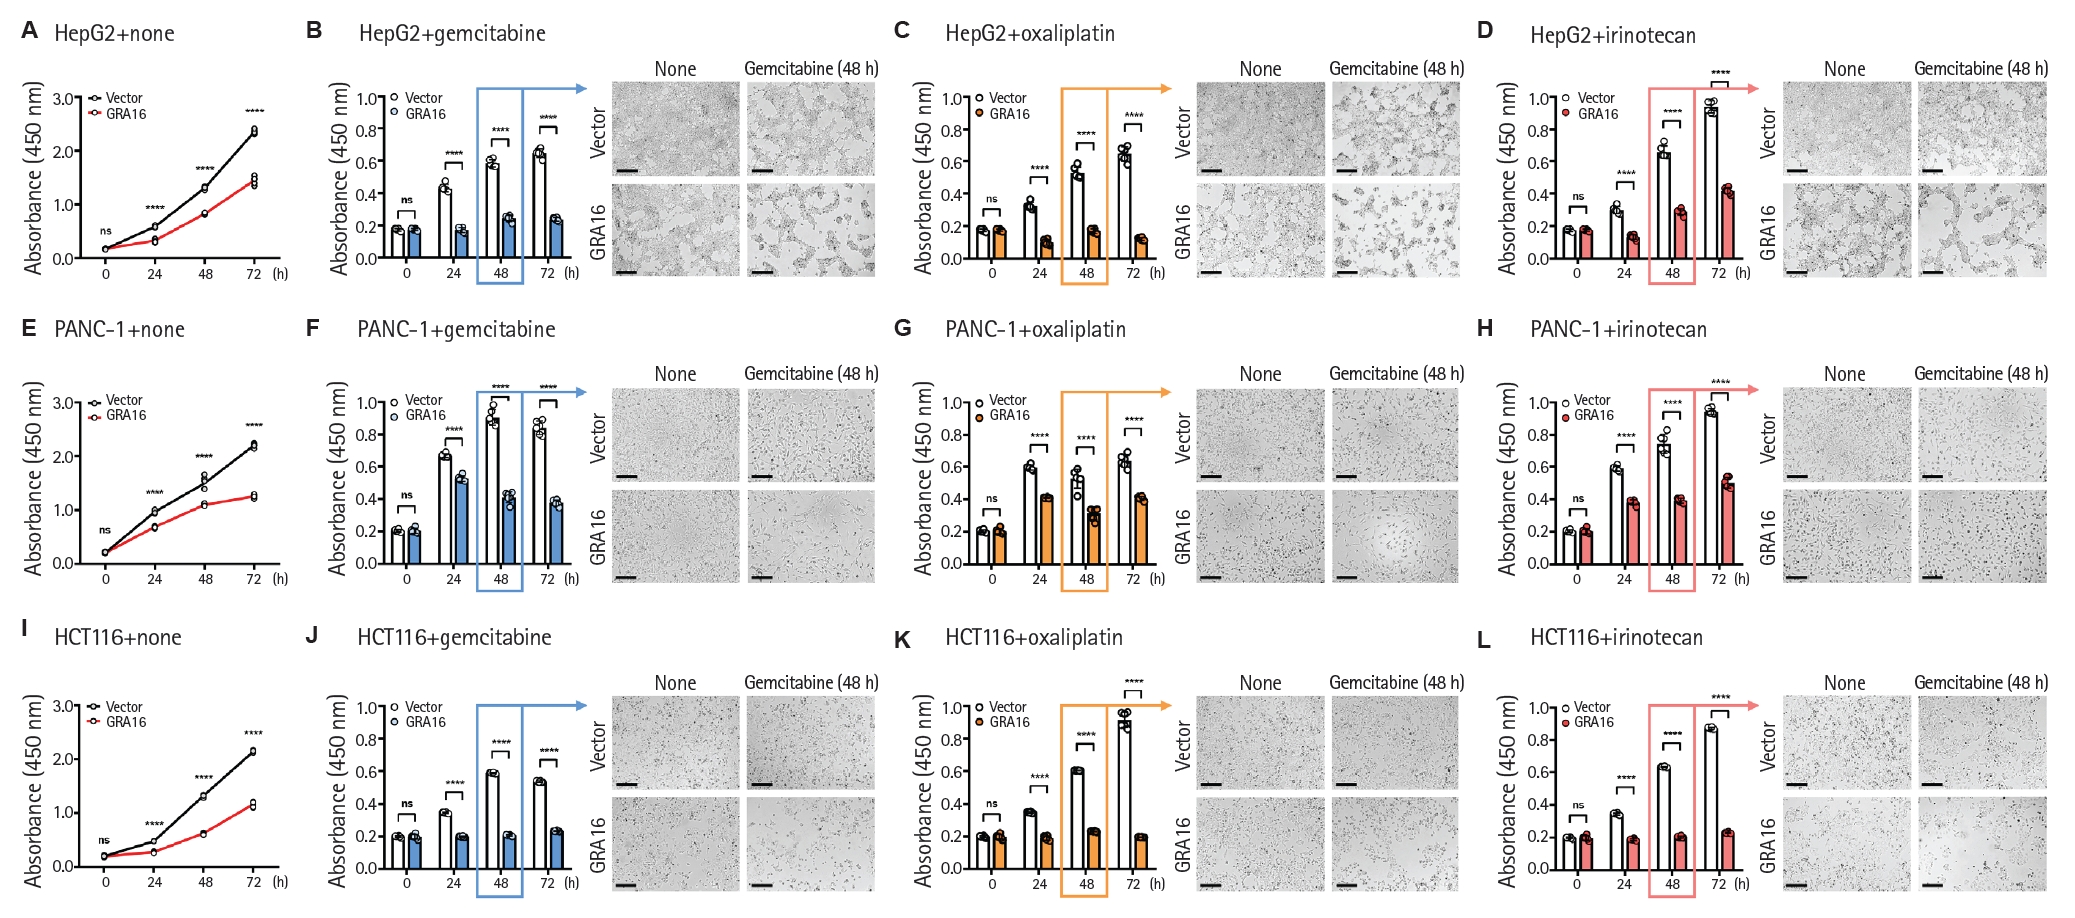
50-normalized concentrations, we compared proliferation over 72 h between vector-expressing and GRA16-expressing cells (
Fig. 2). Under drug-free conditions, GRA16 expression decreased basal proliferation in all 3 cell lines, indicating an intrinsic growth inhibitory effect (
Fig. 2A,
E,
I). When treated with gemcitabine (
Fig. 2B,
F,
J), oxaliplatin (
Fig. 2C,
G,
K), or irinotecan (
Fig. 2D,
H,
L), GRA16-expressing cells consistently showed lower proliferation than vector controls at the corresponding time points under the same treatment conditions across all cell lines. Representative microscopic images, captured at the 48 h time point used for IC
50 calculations, visually corroborate the 0–72 h CCK‑8 results. The accompanying microscopy panels do not represent additional experimental groups, but instead provide representative images of the same Vector and GRA16 groups under untreated and drug-treated conditions at the 48 h time point corresponding to the highlighted bar graph data. In the 48 h images, cells in the GRA16 group exhibited lower cell density under each drug condition compared with the vector group (
Fig. 2B-
D,
F-
H,
J-
L). These results indicate that GRA16 further enhances the growth inhibitory effects of standard anticancer drugs in vitro, even when doses are normalized to reflect the distinct drug sensitivities of each cell line.
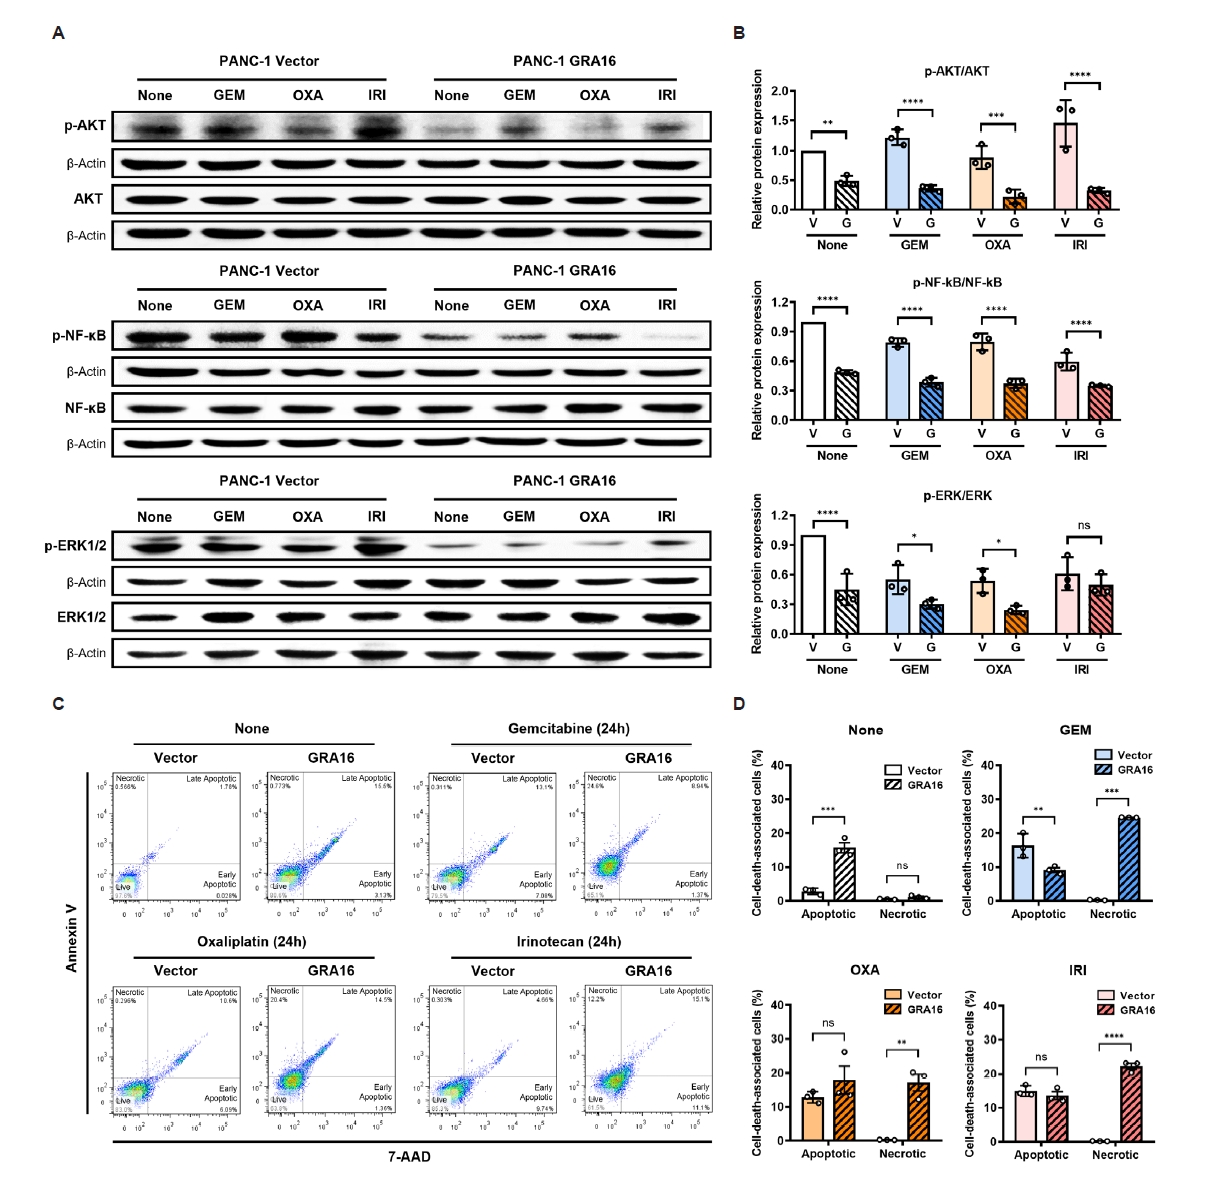
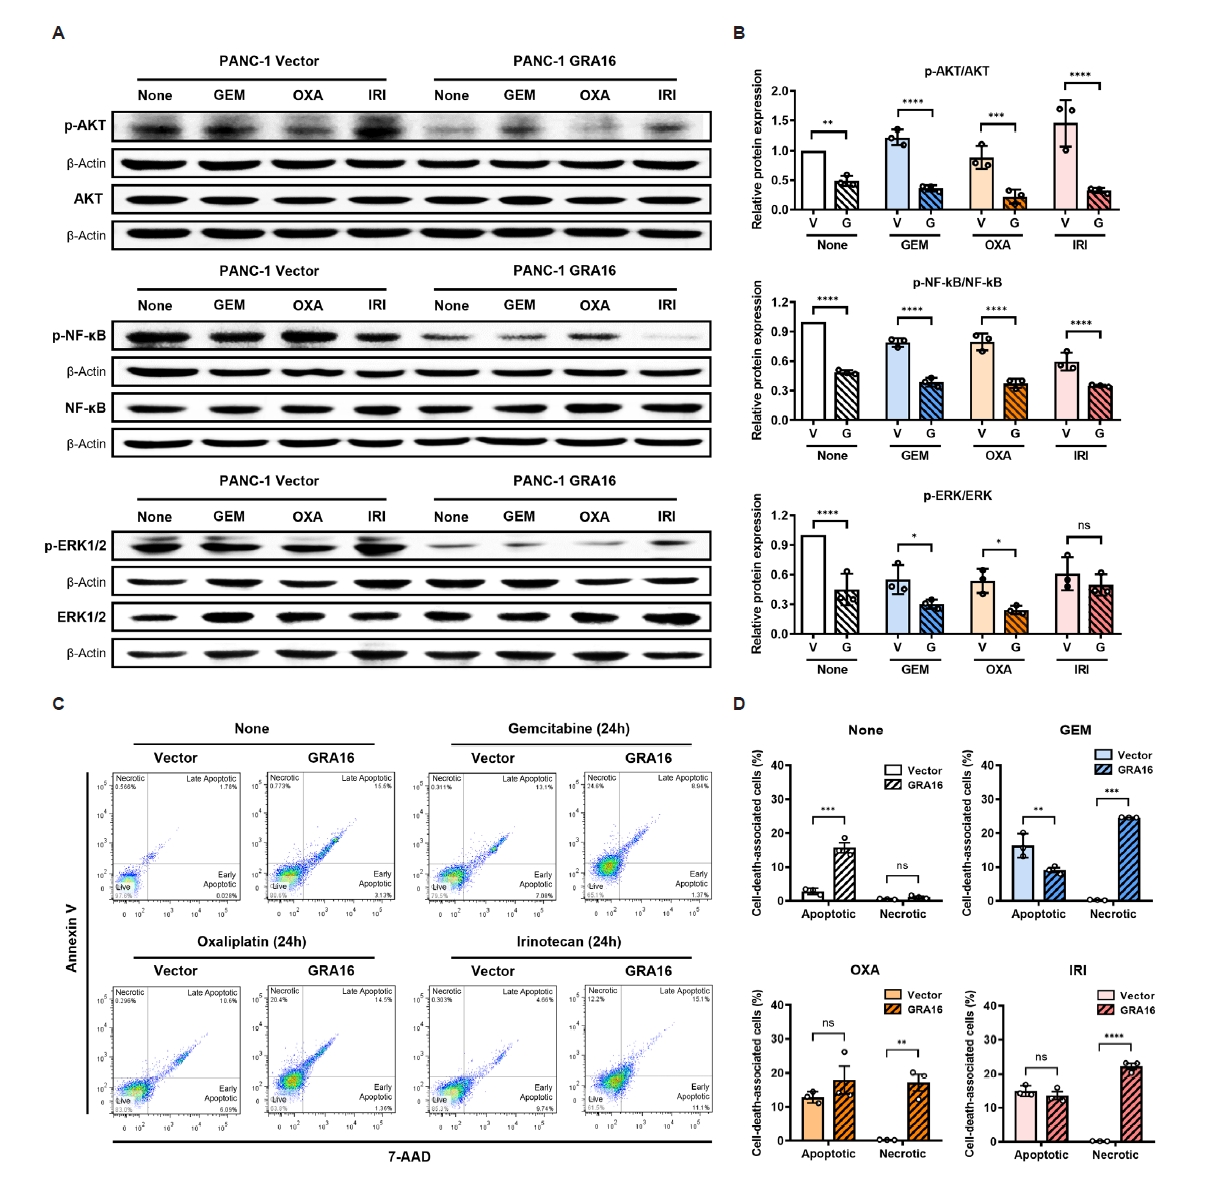
To determine whether the enhanced inhibitory phenotype observed in GRA16-expressing cells was associated with modulation of survival signaling pathways, Western blot analysis was performed in the newly introduced pancreatic cancer model (PANC-1) under untreated and chemotherapeutic treatment conditions (
Fig. 3A,
B). Compared with vector controls, GRA16-expressing PANC-1 cells showed reduced p-AKT/AKT and p-NF-κB/NF-κB expression under both untreated and drug-treated conditions. p-ERK/ERK expression was also reduced in GRA16-expressing cells, although the magnitude of this effect varied depending on the drug condition. These findings provide direct experimental support that the enhanced inhibitory phenotype associated with GRA16 is accompanied by attenuation of AKT-, NF-κB-, and ERK-related signaling in the pancreatic cancer model.
To further assess whether the reduced viability observed in GRA16-expressing cells was associated with cell death, Annexin V/7-AAD flow cytometry was performed in PANC-1 cells under untreated and chemotherapeutic treatment conditions (
Fig. 3C,
D). In untreated cells, GRA16 expression increased the apoptotic population compared with vector controls. Under gemcitabine, oxaliplatin, and irinotecan treatment, the relative proportions of apoptotic and necrotic populations varied by drug; however, GRA16-expressing cells showed increased cell-death-associated populations compared with vector controls. These findings support that the enhanced inhibitory phenotype observed in GRA16-expressing PANC-1 cells was not solely attributable to reduced basal proliferation.
Across HepG2, PANC-1, and HCT116 cells, GRA16 consistently enhanced the inhibitory response to chemotherapeutic treatment. This interpretation is supported not only by our previous studies, which showed that GRA16 can modulate PI3K/AKT, NF-κB, and ERK-related signaling in several cancer models [
9-
12], but also by the present Western blot analysis in the pancreatic cancer model. In PANC-1 cells, GRA16 expression was associated with reduced p-AKT/AKT, p-NF-κB/NF-κB, and p-ERK/ERK levels under untreated and chemotherapeutic treatment conditions. Because these signaling axes are also linked to gemcitabine, oxaliplatin, and irinotecan resistance [
1-
4], the present findings provide direct experimental support that the enhanced inhibitory phenotype is accompanied by attenuation of key pro-survival signaling pathways. A major strength of this study is that it is not limited to a single drug or tumor type, demonstrating enhanced inhibitory effects across 3 clinically relevant chemotherapeutic agents and 3 distinct tumor models. This design offers a practical framework for assessing chemotherapeutic agents in a mechanistically informed manner, reflecting drugs actually used in the treatment of pancreatic and colorectal cancers [
5-
8]. In addition, this is the first report evaluating GRA16-associated enhancement of chemotherapeutic inhibitory effects in a pancreatic cancer model, expanding the scope of previous studies focused on non-small cell lung cancer and colorectal cancer [
10,
12].
Collectively, our results support the possibility that GRA16 enhances the inhibitory effects of chemotherapeutic treatment in multiple cancer cell types. Together with previous reports [
9-
12], the present pancreatic cancer data further support pathway modulation as one plausible explanation for this effect. By extending our analysis across multiple tumor types and 3 clinically relevant agents, 2 DNA-damaging drugs and a Topo-I inhibitor, this study establishes a cross-cancer, multi-drug framework for evaluating GRA16-associated enhancement of chemotherapeutic response. In addition, the inclusion of the pancreatic cancer model expands the scope of previous GRA16-related cancer studies [
10-
12]. Moreover, GRA16 decreased basal proliferation even in the absence of drug exposure, demonstrating a drug-independent antiproliferative effect that likely contributes to the overall growth-inhibitory phenotype.
In this study, HepG2 was primarily used as a comparative model to assess whether the GRA16-mediated inhibitory effect is consistent across different tumor backgrounds, rather than to recapitulate hepatocellular carcinoma-specific treatment indications. The 3 agents were chosen to represent DNA-damaging mechanisms and Topo-I inhibition rather than standard therapies for individual cancer types, with the analysis emphasizing mechanism-based alterations in drug response.
Although the present study now includes direct mechanistic validation in the pancreatic cancer model, pathway modulation was not comprehensively examined across all cell lines and treatment conditions. Therefore, broader interpretation regarding AKT, NF-κB, and ERK signaling should still be made with caution. Future studies should extend this validation to additional tumor models and further define how these pathways contribute to the observed inhibitory phenotype. Nevertheless, the consistent proliferation reduction across all 3 cell lines and drugs underscores the robustness of the inhibitory-response pattern and supports further evaluation of GRA16 in combination with standard chemotherapy in hepatocellular carcinoma, pancreatic cancer, and colorectal cancer models.
Notes
-
Data availability
The datasets used and/or analyzed in this study are available from the corresponding author and can be provided on reasonable request.
-
Author contributions
Conceptualization: Seo SH, Shin EH. Data curation: Seo SH, Shin EH. Funding acquisition: Shin EH, Seo SH. Investigation: Seo SH, Lee JE, Cho EJ. Methodology: Seo SH, Lee JE. Writing–original draft: Seo SH. Writing–review & editing: Seo SH, Shin EH.
-
Conflict of interest
Eun-Hee Shin serves as an editor of Parasites, Hosts and Diseases but had no involvement in the decision to publish this article. No other potential conflicts of interest relevant to this study were reported.
-
Funding
This work was supported by the National Research Foundation of Korea (NRF) grant funded by the Korea government (MSIT) (IRIS No. RS-2025-00516274 and RS-2025-00559259).
Supplementary information
Fig. 1.RT-PCR validation of GRA16 expression and 50% inhibitory concentration (IC50) determination in vector control cells. (A) RT-PCR validation of construct expression in HepG2 stable cell populations. (B) Dose-response curves of HepG2 vector control cells treated with gemcitabine, oxaliplatin, or irinotecan at 0 to 64 μM for 48 h. Cell viability was measured by CCK-8 at 450 nm and normalized to 0 μM (100% viability). Dotted lines denote 50% viability, and asterisks indicate significant differences versus untreated cells (0 μM). (C) IC50 values estimated by linear interpolation from the corresponding HepG2 dose-response curves. (D) RT-PCR validation of construct expression in PANC-1 stable cell populations. (E) Dose-response curves of PANC-1 vector control cells treated as described above. (F) IC50 values estimated by linear interpolation from the corresponding PANC-1 dose-response curves. (G) RT-PCR validation of construct expression in HCT116 stable cell populations. (H) Dose-response curves of HCT116 vector control cells treated as described above. (I) IC500 values estimated by linear interpolation from the corresponding HCT116 dose-response curves. In the RT-PCR analyses, vector cells showed only the GFP-target band (Vp, 364 bp), whereas GRA16-expressing cells showed both the GFP-target band (Vp, 364 bp) and the GRA16-target band (Gp, 1,237 bp). Statistical analysis was performed using one-way ANOVA followed by Dunnett’s multiple comparisons test in GraphPad Prism 8. Data are expressed as mean±SD for each group (n=6 independent biological replicates). Significance was defined as follows: *P<0.05, **P<0.01, ***P<0.001, ****P<0.0001 vs. untreated cells (0 μM).
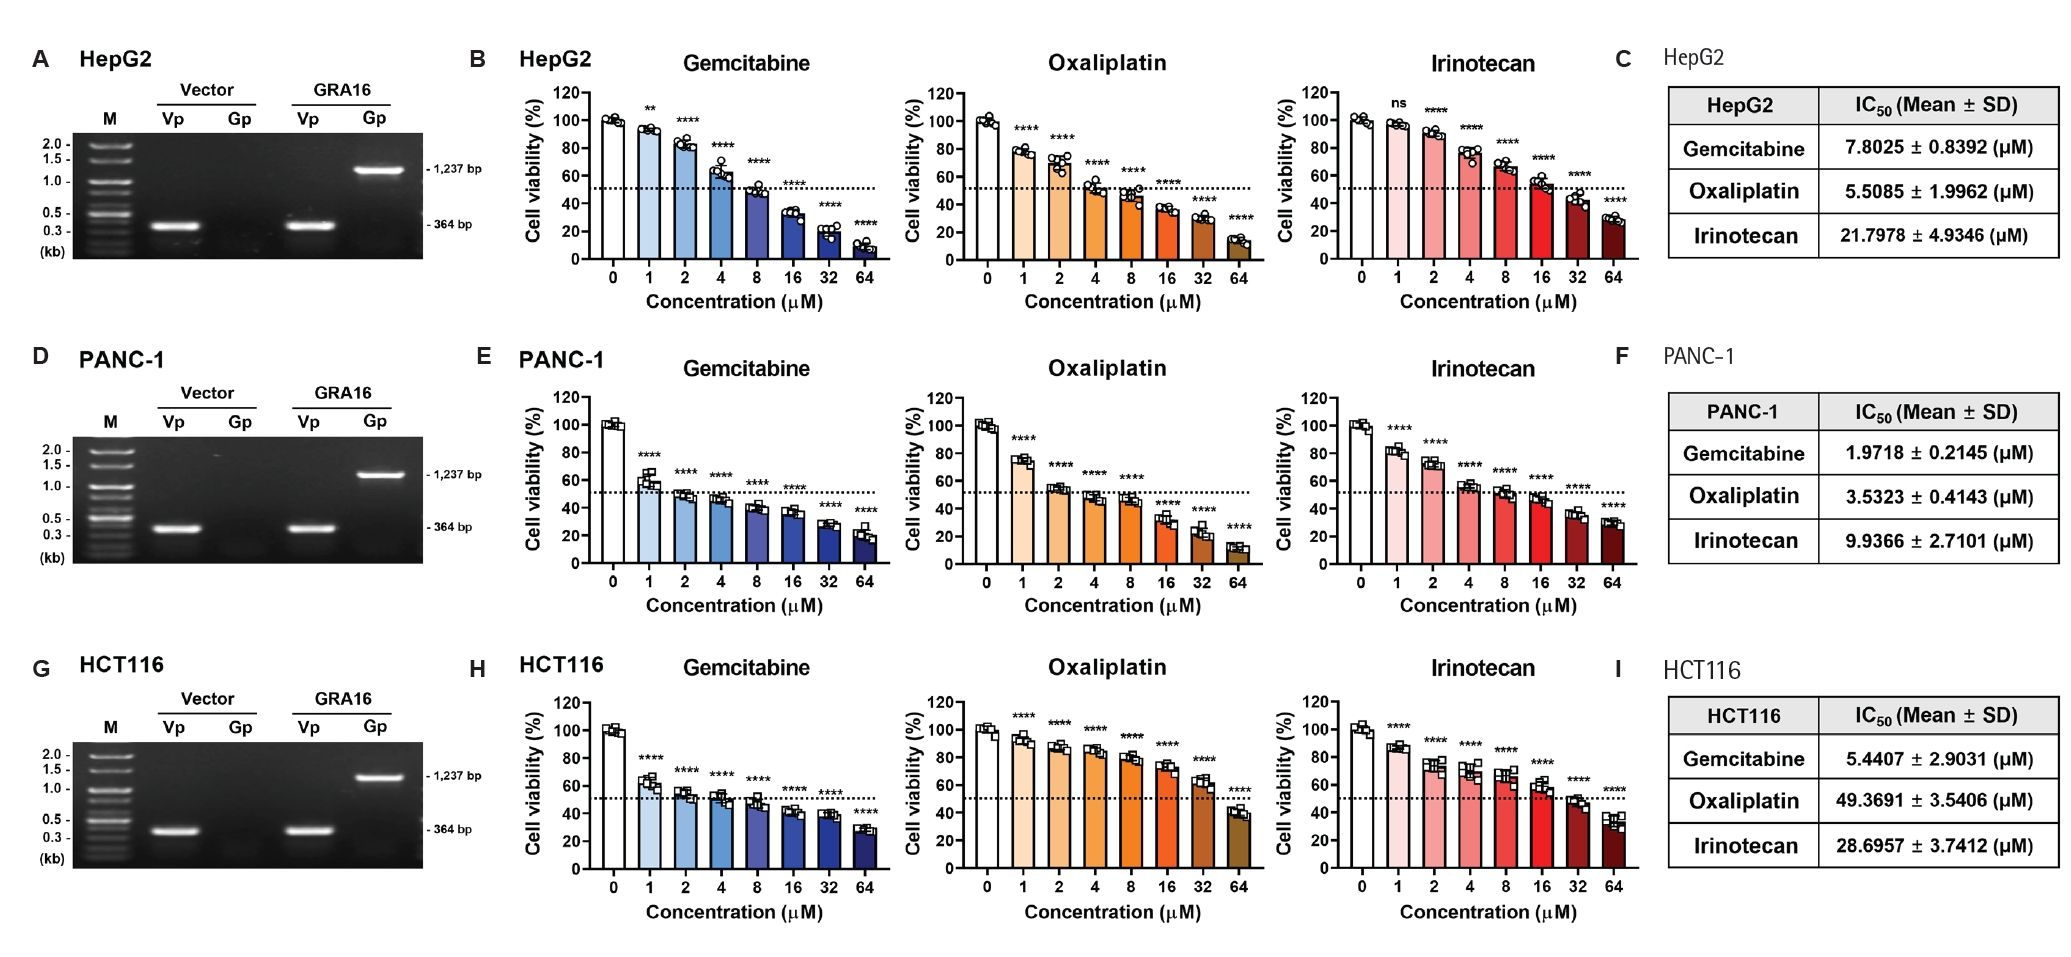
Fig. 2.GRA16 decreases basal proliferation and enhances inhibitory drug effects across 3 cell lines. (A-D) HepG2, (E-H) PANC‑1, and (I-L) HCT116 vector control and GRA16‑expressing cells were analyzed by CCK‑8 over 0–72 h at 24 h intervals. (A, E, I) No drug (baseline proliferation); (B, F, J) gemcitabine; (C, G, K) oxaliplatin; (D, H, L) irinotecan, each administered at the 50% inhibitory concentration defined in
Fig. 1. In each drug-treatment panel, the bar graphs show quantitative comparisons between the 2 experimental groups (Vector and GRA16) at each time point, whereas the accompanying microscopy panels show representative phase-contrast images of the same 2 groups under 2 conditions: untreated (None) and drug-treated at 48 h. The highlighted 48 h time point in the bar graphs corresponds to the representative microscopy images. Statistical analysis was performed using two-way ANOVA followed by Šídák’s multiple comparisons test in GraphPad Prism 8, with comparisons made between the Vector and GRA16 groups at the same time point. Data are expressed as mean±SD for each group (
n=6 independent biological replicates). Scale bar=250 μm. Significance was defined as follows:
*P<0.05,
**P<0.01,
***P<0.001,
****P<0.0001 vs. Vector at the same time point.
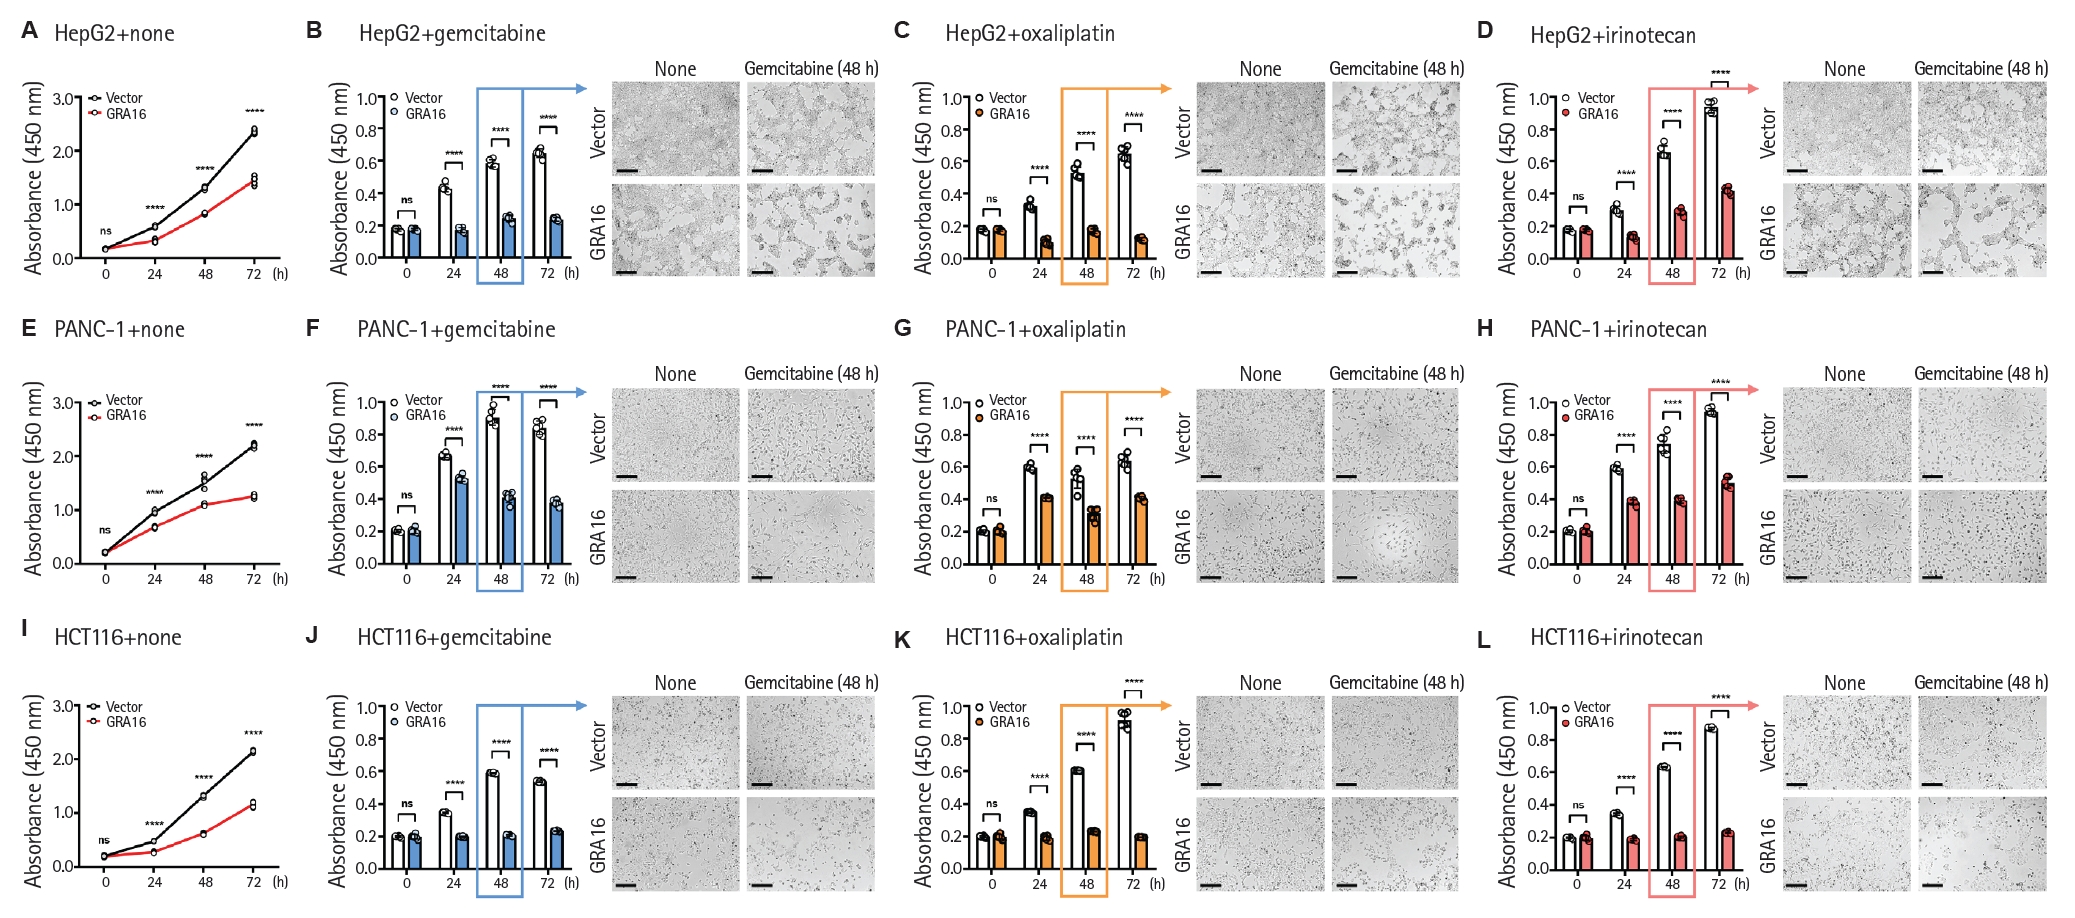
Fig. 3.Mechanistic and cell-death-associated validation in PANC-1 cells. (A) Representative Western blot images showing p-AKT, AKT, p-NF-κB, NF-κB, p-ERK1/2, and ERK1/2 expression in PANC-1 vector and GRA16-expressing cells under untreated conditions or after treatment with gemcitabine (GEM), oxaliplatin (OXA), or irinotecan (IRI) for 24 h. (B) Quantification of relative p-AKT/AKT, p-NF-κB/NF-κB, and p-ERK/ERK expression. (C) Representative Annexin V/7-AAD flow cytometry plots of PANC-1 vector and GRA16-expressing cells under untreated and drug-treated conditions. (D) Quantification of apoptotic cells, calculated as the sum of early and late apoptotic populations, and necrotic cells. Statistical analysis for Western blot quantification was performed using two-way ANOVA followed by Holm–Šídák’s multiple comparisons test in GraphPad Prism 8, whereas apoptosis/cell-death-associated population data were analyzed using two-way ANOVA followed by Šídák’s multiple comparisons test. In both analyses, comparisons were made between the Vector and GRA16 groups within each treatment condition. Data are expressed as mean±SD for each group (n=3 independent biological replicates). Significance was defined as follows: *P<0.05, **P<0.01, ***P<0.001, ****P<0.0001 vs. Vector within the same treatment condition. ns, not significant.
References
- 1. Chiu CH, Lin YJ, Ramesh S, et al. Gemcitabine resistance in non‐small cell lung cancer is mediated through activation of the PI3K/AKT/NF‐κB pathway and suppression of ERK signaling by reactive oxygen species. J Biochem Mol Toxicol 2023;37:e23497. https://doi.org/10.1002/jbt.23497
- 2. Chen S, Chen A. Geniposide reverses oxaliplatin resistance in colorectal cancer via suppression of PI3K/AKT pathway. Rev Invest Clín 2025;77:100022. https://doi.org/10.1016/j.ric.2025.100022
- 3. Saurav S, Karfa S, Vu T, et al. Overcoming irinotecan resistance by targeting its downstream signaling pathways in colon cancer. Cancers (Basel) 2024;16:3491. https://doi.org/10.3390/cancers16203491
- 4. Jassi C, Kuo WW, Chang YC, et al. Aloin and CPT-11 combination activates miRNA-133b and downregulates IGF1R-PI3K/AKT/mTOR and MEK/ERK pathways to inhibit colorectal cancer progression. Biomed Pharmacother 2023;169:115911. https://doi.org/10.1016/j.biopha.2023.115911
- 5. Conroy T, Desseigne F, Ychou M, et al. FOLFIRINOX versus gemcitabine for metastatic pancreatic cancer. N Engl J Med 2011;364:1817-25. https://doi.org/10.1056/NEJMoa1011923
- 6. Goldberg RM, Sargent DJ, Morton RF, et al. A randomized controlled trial of fluorouracil plus leucovorin, irinotecan, and oxaliplatin combinations in patients with previously untreated metastatic colorectal cancer. J Clin Oncol 2004;22:23-30. https://doi.org/10.1200/JCO.2004.09.046
- 7. Sciortino C, Nichetti F, Bergamo F, et al. A phase III randomized clinical trial of gemcitabine and nab-paclitaxel as switch maintenance versus continuation of modified FOLFIRINOX as first-line chemotherapy in patients with advanced pancreatic cancer: the PANThEON Study. Dig Liver Dis 2025;57:2470-7. https://doi.org/10.1016/j.dld.2025.11.007
- 8. Zhang X, Duan R, Wang Y, et al. FOLFIRI (folinic acid, fluorouracil, and irinotecan) increases not efficacy but toxicity compared with single-agent irinotecan as a second-line treatment in metastatic colorectal cancer patients: a randomized clinical trial. Ther Adv Med Oncol 2022;14:17588359211068737. https://doi.org/10.1177/17588359211068737
- 9. Kim SG, Seo SH, Shin JH, et al. Increase in the nuclear localization of PTEN by the Toxoplasma GRA16 protein and subsequent induction of p53‐dependent apoptosis and anticancer effect. J Cell Mol Med 2019;23:3234-45. https://doi.org/10.1111/jcmm.14207
- 10. Seo SH, Kim SG, Shin JH, Ham DW, Shin EH. Toxoplasma GRA16 inhibits NF-κB activation through PP2A-B55 upregulation in non-small-cell lung carcinoma cells. Int J Mol Sci 2020;21:6642. https://doi.org/10.3390/ijms21186642
- 11. Seo SH, Shin JH, Ham DW, Shin EH. PTEN/AKT signaling pathway related to hTERT downregulation and telomere shortening induced in Toxoplasma GRA16-expressing colorectal cancer cells. Biomed Pharmacother 2022;153:113366. https://doi.org/10.1016/j.biopha.2022.113366
- 12. Lee JE, Seo SH, Ham DW, Shin EH. Toxoplasma gondii GRA16 suppresses aerobic glycolysis by downregulating c-Myc and TERT expressions in colorectal cancer cells. Biomol Ther (Seoul) 2025;33:621-35. https://doi.org/10.4062/biomolther.2025.040