Abstract
Colorectal cancer (CRC) with KRAS mutations represents a clinically challenging subgroup with variable treatment responses. Among these tumors, codon 12 mutations are associated with poor prognosis and treatment resistance, while KRASG12D-mutant CRCs lack effective mutation-specific therapeutic options. Toxoplasma gondii dense granule protein 16 (GRA16) is a parasite-derived host-modulating effector that modulates phosphatase and tensin homolog (PTEN)/p53, protein phosphatase 2A-B55 (PP2A-B55)-associated signaling, and cancer-associated metabolic pathways. We evaluated the anticancer effects of GRA16 in KRASG12D-mutant LS174T cells using KRASG13D-mutant HCT116 cells as a comparative TP53-wild-type CRC model. Stable GRA16-expressing cells were generated by lentiviral transduction and assessed for proliferation, cell death-associated responses, DNA damage/apoptosis-related protein markers, key signaling proteins, and targeted transcriptional changes. GRA16 inhibited proliferation and increased cell death-associated populations in both cell lines, accompanied by elevated γ-H2A.X, cleaved PARP, and cleaved caspase-3 levels. In HCT116 cells, GRA16 increased PTEN, p53, and PP2A-B55 protein levels and reduced total AKT and Survivin proteins, together with BAX induction and suppression of cell-cycle/checkpoint-, epithelial mesenchymal transition/motility-, and glycolysis-associated transcripts. In LS174T cells, GRA16 increased PP2A-B55 and reduced Survivin protein levels, whereas PTEN protein was unchanged, p53 was reduced, and total AKT was increased. These changes were accompanied by limited p53/BAX-associated transcriptional engagement, glycolytic attenuation, shared cell-cycle/checkpoint-associated gene suppression, and stress-adaptive remodeling. These findings suggest that GRA16 induces cell line-dependent anticancer-associated responses in KRAS-mutant CRC cells, with a prominent PTEN/p53-associated response in HCT116 cells and preserved PP2A-B55 induction and Survivin suppression in LS174T cells.
-
Key words: Toxoplasma gondii, GRA16, colorectal cancer, KRASG12D, apoptosis, signal transduction
Introduction
Colorectal cancer (CRC) is a prevalent malignancy and a leading cause of cancer-related mortality globally [
1]. Its development is driven by the progressive accumulation of molecular alterations impacting oncogenic and tumor-suppressive pathways, including APC inactivation, KRAS activation, and TP53 alteration [
2,
3]. Among these alterations, activating KRAS mutations are frequently detected and have important clinical implications, including refractoriness to anti-EGFR therapy and variable therapeutic outcomes [
3]. Therefore, KRAS-mutant CRC is increasingly being recognized as a molecularly diverse subgroup rather than a single uniform entity, with individual KRAS variants potentially contributing to differences in signaling behavior, treatment sensitivity, and clinical outcomes [
3].
Among KRAS-mutant CRCs, codon 12 mutations occur more frequently than codon 13 mutations and have been linked to more aggressive biological behavior and poorer therapeutic outcomes [
3-
5]. Although recent advances in KRAS
G12C-directed therapeutic combinations have expanded treatment options for a small subset of patients with KRAS
G12C-mutant metastatic CRC, these strategies remain allele-specific and do not address the more prevalent KRAS alterations, including KRAS
G12D [
4,
6,
7]. KRAS
G12D is among the most prevalent codon 12 variants in CRC and currently lacks a broadly effective mutation-specific therapeutic strategy [
4,
5]. Thus, identifying novel agents capable of suppressing KRAS
G12D-mutant CRC represents an important therapeutic gap.
Previous studies have reported that KRAS
G12D can promote phosphoinositide 3-kinase–AKT–mechanistic target of rapamycin pathway in a mutation subtype-dependent manner [
8]. This is particularly relevant to p53-mediated tumor suppression because AKT activation can modulate the MDM2–p53 axis. Akt-mediated phosphorylation of MDM2 promotes MDM2-dependent ubiquitination and p53 degradation, thereby limiting p53-dependent apoptosis and growth-inhibitory responses [
9]. Therefore, KRAS
G12D-mutant CRC represents a clinically relevant setting in which p53-dependent anticancer responses may vary according to the broader molecular and cellular context, even when wild-type TP53 is retained.
The obligate intracellular protozoan parasite
Toxoplasma gondii secretes dense granule proteins that are exported beyond the parasitophorous vacuole into host cellular compartments, where they can influence host signaling and gene expression pathways [
10]. Among these parasite-derived effectors, dense granule protein 16 (GRA16) has emerged as a multifunctional host-modulating molecule with potential anticancer activity. Previous studies have demonstrated that GRA16 interacts with ubiquitin-specific peptidase 7 (USP7), also known as herpesvirus-associated ubiquitin-specific protease (HAUSP), facilitates phosphatase and tensin homolog (PTEN) nuclear localization, and promotes p53-dependent apoptotic signaling in p53-competent cancer cells [
11]. It also upregulates protein phosphatase 2A-B55 (PP2A-B55) and suppresses nuclear factor-κB activation, linking GRA16 to inflammatory and survival-associated signaling pathways [
12]. In CRC cells, GRA16 has been shown to modulate telomerase reverse transcriptase-associated oncogenic processes, including PTEN/AKT-related telomere regulation and c-Myc/telomerase reverse transcriptase-mediated aerobic glycolysis [
13,
14]. Together, these findings suggest that GRA16 can influence multiple signaling axes implicated in KRAS-mutant CRC, including PTEN/p53-associated tumor suppression, PTEN/AKT-associated telomere regulation, PP2A-B55-associated signaling, and cancer metabolism.
Despite these advances, the ability of GRA16 to induce anticancer responses in KRASG12D-mutant CRC cells remains unclear. This issue is particularly important because p53-dependent tumor-suppressive responses may vary substantially across KRAS-mutant CRC cells according to their broader molecular and cellular context. HCT116 and LS174T cells provide a suitable comparative framework to address this issue because both are TP53-wild-type CRC cell lines yet differ in their KRAS hotspot mutations, with HCT116 harboring KRASG13D and LS174T bearing KRASG12D. This comparative setting enabled us to evaluate whether GRA16-mediated anticancer-associated responses were also observed in KRASG12D-mutant LS174T cells and to characterize differences in the response patterns between the 2 TP53-wild-type CRC cell lines.
In this study, we generated stable GRA16-expressing HCT116 and LS174T CRC cell lines and investigated proliferation, cell death-associated phenotypes, and targeted transcriptional responses involving p53-associated and PP2A-B55–associated genes. We hypothesized that GRA16 would induce PTEN- and PP2A-B55–associated signaling in both KRAS-mutant CRC cell lines, whereas the accompanying p53/BAX-associated transcriptional patterns and anticancer phenotypes would differ between HCT116 and LS174T cells. By comparing these 2 independently derived TP53-wild-type KRAS-mutant CRC cell lines, this study aimed to characterize GRA16-induced response patterns in KRASG12D-mutant LS174T cells relative to those observed in HCT116 cells.
Methods
Ethics statement
Ethical approval was not required because this study did not involve human participants or animal experiments.
Cell culture
Human CRC cell lines HCT116 and LS174T were procured from the Korean Cell Line Bank. HCT116 cells harboring KRASG13D and wild-type TP53 and LS174T cells harboring KRASG12D and wild-type TP53 were used as 2 independently derived KRAS-mutant CRC cell models. HCT116 cells were cultured in RPMI1640 medium (Welgene) while the LS174T were maintained in DMEM (Welgene), both supplemented with 10% fetal bovine serum (Thermo Fisher Scientific) and 1% antibiotic-antimycotic (Cellpick). Cell cultures were maintained at 37°C in a humidified atmosphere containing 5% CO2.
Lentiviral production and cell transduction
The GRA16 coding sequence derived from the T. gondii RH strain (ATCC) was cloned into the pWPXL lentiviral transfer vector (Addgene). Recombinant lentiviral particles harboring GRA16 (pWPXL-GRA16) and empty vectors (pWPXL-Vector) were generated by co-transfecting Lenti-X 293T packaging cells (Takara Bio) with the transfer plasmid, pMD2.G envelope plasmid, and psPAX2 packaging plasmid (Addgene). Viral supernatants were harvested 48 h after transfection, filtered through a 0.45-µm membrane, and used to transduce HCT116 and LS174T cells in the presence of 8 µg/ml polybrene (Santa Cruz Biotechnology). Following transduction, green fluorescent protein (GFP)-positive cells were isolated using a SH800 cell sorter (Sony Biotechnology), and stable GRA16-expressing and vector control cell populations were employed for subsequent experiments.
Genomic PCR validation of lentiviral transgene integration
Genomic DNA was isolated from stable vector and GRA16-expressing cell populations using the DNeasy Blood & Tissue Kit (Qiagen). Lentiviral transgene integration was confirmed by PCR using primer sets specific for GFP and GRA16 (
Table 1). PCR amplification was performed using a SureCycler 8800 Thermal Cycler (Agilent Technologies) with the following parameters: initial denaturation at 95°C for 5 min, followed by 35 cycles of 95°C for 30 sec, 58℃ for 40 sec, and 72℃ for 90 sec, followed by a final extension at 72℃ for 3 min. PCR products were separated by 0.8% agarose gel electrophoresis and visualized using a Gel Doc XR+ system (Bio-Rad Laboratories).
Whole-cell proteins were prepared using M-PER Mammalian Protein Extraction Reagent (Thermo Fisher Scientific). Total proteins were resolved by 10% SDS-PAGE and transferred onto PVDF membranes using a Mini Trans-Blot electrophoretic transfer system (Bio-Rad Laboratories) at 100 V for 1 h at 4°C. Membranes were blocked for 1 h at room temperature in Tris-buffered saline (pH 7.6, 0.1% Tween-20) supplemented with 5% bovine serum albumin, followed by overnight incubation at 4℃ with an anti-GFP primary antibody (Cell Signaling Technology, catalog No. 2955). After washing with TBS-T, membranes were incubated with an HRP-conjugated secondary antibody (Santa Cruz Biotechnology) for 1 h at room temperature. Protein signals were detected using Pierce ECL Western Blotting Substrate (Thermo Fisher Scientific) and visualized with an Amersham Imager 680 (GE Healthcare).
To evaluate DNA damage-, apoptosis-, and signaling-associated protein changes, whole-cell lysates were collected from stable vector control and GRA16-expressing HCT116 and LS174T cells. Equal amounts of protein were fractionated using SDS-PAGE and transferred onto PVDF membranes. The membranes were incubated with primary antibodies against γ-H2A.X (Cell Signaling Technology, catalog No. 2521), poly (ADP-ribose) polymerase (PARP) (Cell Signaling Technology, catalog No. 9542), caspase-3 (Santa Cruz Biotechnology, catalog No. sc-136219), PTEN (Santa Cruz Biotechnology, catalog No. sc-7974), p53 (Cell Signaling Technology, catalog No. 9282), AKT (Cell Signaling Technology, catalog No. 9272), Survivin (AB clonal, catalog No. A22034), PP2A-B55 (Santa Cruz Biotechnology, catalog No. sc-365282), and β-actin (Santa Cruz Biotechnology, catalog No. sc-47778). Following washes with TBS-T, membranes were incubated with mIgGκ BP-HRP (Santa Cruz Biotechnology, catalog No. sc-516102) or goat anti-rabbit IgG-HRP (Bethyl Laboratories, catalog No. A120-101P), as appropriate. Immunoreactive signals were visualized by enhanced chemiluminescence using an Amersham Imager 680. Band intensities were quantified using image analysis software and normalized to β-actin. Relative expression levels were determined by setting the corresponding vector control group to 1.0. Western blot analyses were performed using 3 independent biological replicates per condition, with each replicate derived from an independently cultured cell population.
Fluorescence analysis
GFP-tagged GRA16-expressing cells and corresponding vector control cells were examined by fluorescence microscopy. For nuclear staining, cells were incubated with Hoechst 33342 (Sigma-Aldrich) at a final concentration of 5 µg/ml for 5 min at room temperature in the dark. Following PBS washes, cells were immediately visualized using a DE/DMI6000B inverted fluorescence microscope (Leica). Fluorescence microscopy was performed using 3 independent biological replicates per condition, with cells independently cultured, seeded, stained, and imaged for each replicate.
Cell proliferation
Cell proliferation was determined using the Cell Counting Kit-8 (CCK-8, Dojindo) following the manufacturer’s instructions. Briefly, cells were seeded in 96-well plates at a density of 3×10³ cells per well. For each experimental condition, cells from 5 independently cultured dishes were separately harvested, counted, and seeded into individual wells of 96-well plates, yielding 5 independent biological replicates per condition. At 0, 24, 48, 72, and 96 h post-seeding, 10 µl of CCK-8 reagent was added to each well and incubated for 1 h at 37°C. Absorbance was then measured at 450 nm using an Infinite 200 PRO microplate reader (Tecan).
Annexin V/7-AAD flow cytometric analysis
Cell death-associated responses were assessed using an Annexin V Apoptosis Detection Kit with 7-AAD (BioLegend) following the manufacturer’s instructions. Cells were harvested from stable vector control and GRA16-expressing cultures, counted, and seeded into separate 60-mm dishes at a density of 1×10⁶ cells per dish for each designated time point. The 0-h samples were collected and analyzed immediately after seeding, whereas the remaining samples were maintained in complete medium containing 10% FBS and analyzed after 24, 48, or 72 h of culture. At each time point, cells were harvested using trypsin-EDTA, collected by centrifugation, washed once with PBS, and resuspended in 100 µL of Annexin V binding buffer. Annexin V-APC (5 µl) and 7-AAD (5 µl) were added, and the samples were incubated for 15 min at room temperature in the dark. Following the addition of 400 µl of binding buffer, samples were analyzed using a FACSCanto II flow cytometer (BD Biosciences). Viable, early apoptotic, late apoptotic, and necrotic cell populations were quantified based on Annexin V and 7-AAD staining. Flow cytometric analyses were performed using 3 independent biological replicates per condition, with each replicate independently cultured, stained, and analyzed.
Real-time quantitative PCR
Total RNA was isolated from stable cell lines using HiGene Total RNA Prep Kit (BIOFACT) following the manufacturer’s instructions. cDNA was synthesized from 1 µg of total RNA using a reverse transcription premix (Elpis Biotech). Quantitative PCR was performed using TOPreal qPCR 2X PreMIX (SYBR Green with low ROX, Enzynomics) on a CFX96 Touch Real-Time PCR Detection System (Bio-Rad Laboratories). The quantitative PCR (qPCR) amplification protocol was as follows: initial denaturation at 95℃ for 15 min, followed by 40 cycles of 95℃ for 20 sec, 59℃ for 20 sec, and 72℃ for 30 sec. Expression profiles of 36 p53- and 20 PP2A-B55–associated genes were examined using iQ5 Optical System Software (Bio-Rad Laboratories). GAPDH served as the housekeeping reference gene. Relative gene expression was determined using the 2
−ΔΔCt method, with the corresponding vector control group set to 1.0 for each cell line. Primer sequences were acquired from OriGene Technologies and are listed in
Table 1. qPCR analyses were performed using 5 independent biological replicates per condition, with RNA isolated separately from independently cultured cell populations.
Statistical analyses were conducted using Prism version 8 (GraphPad). Data are expressed as the mean±SD. Cell proliferation assays were performed using 5 independent biological replicates per condition, with each replicate derived from a separately cultured dish. Differences between vector control and GRA16-expressing cells at individual time points were analyzed separately for each cell line using two-way analysis of variance (ANOVA) followed by Šídák’s multiple comparisons test. Fluorescence microscopy was performed using 3 independent biological replicates per condition. For Annexin V/7-AAD flow cytometric analyses, data were obtained from 3 independent biological replicates per condition, and the proportions of viable, early apoptotic, late apoptotic, and necrotic cell populations were compared using two-way ANOVA followed by Šídák’s multiple comparisons test. For qPCR analyses, relative gene expression levels were determined using the 2−ΔΔCt method, with the corresponding vector control group set to 1.0 for each cell line. qPCR analyses were performed using 5 independent biological replicates per condition. Statistical comparisons for each gene were conducted using one-way ANOVA followed by Šídák’s multiple comparisons test. Western blot densitometric analyses were based on 3 independent biological replicates per condition. Protein band intensities were normalized to β-actin, and relative protein expression levels were calculated by setting the corresponding vector control group to 1.0 for each cell line. Differences between vector control and GRA16-expressing cells were assessed using unpaired two-tailed Student t-test. Adjusted P-values were applied to determine statistical significance for multiple comparison analyses where applicable. Statistical significance was denoted as *P<0.05, **P<0.01, ***P<0.001, and ****P<0.0001.
Results
Establishment and validation of stable GRA16-expressing CRC cells
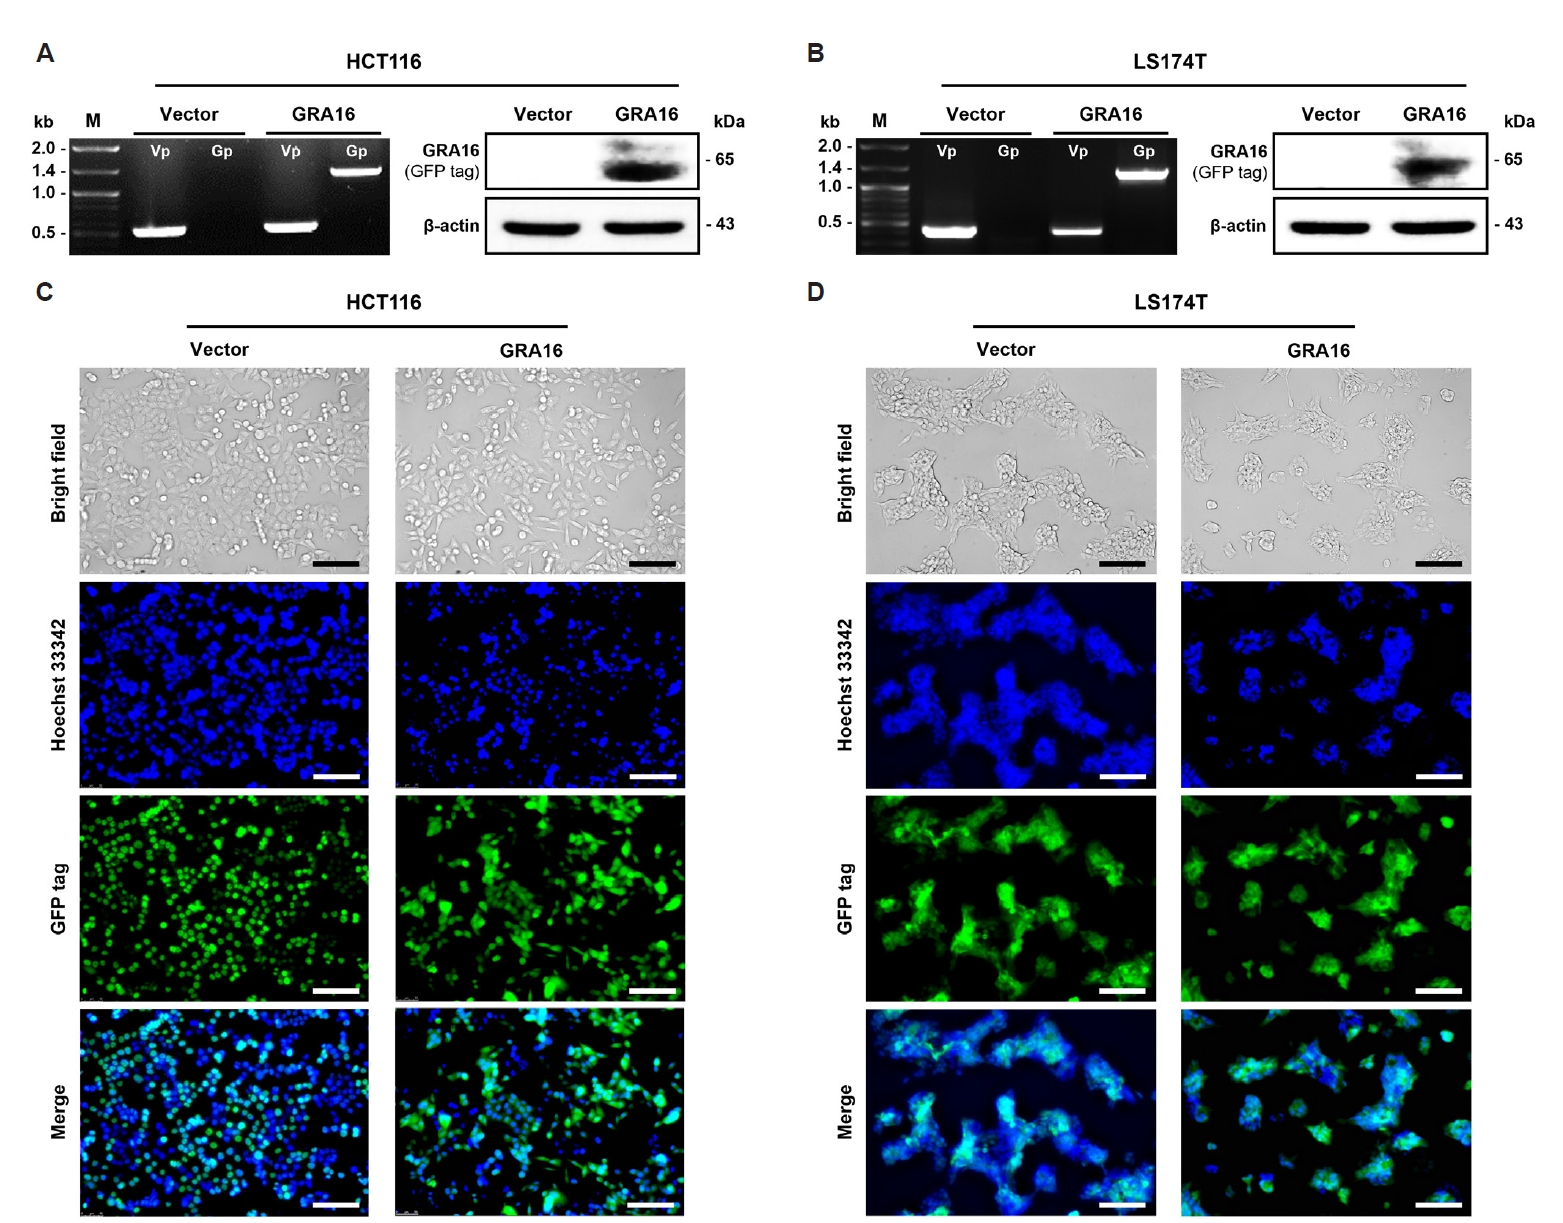
To evaluate the anticancer potential of GRA16 in KRAS-mutant CRC models, stable GRA16-expressing HCT116 and LS174T cells were generated through recombinant lentiviral transduction. Corresponding vector control populations were developed using empty pWPXL lentivirus. In HCT116 cells, genomic PCR confirmed vector-derived GFP integration in both vector control and GRA16-expressing cells, while GRA16-specific amplification was observed exclusively in the GRA16-expressing population. Western blot analysis using an anti-GFP antibody further confirmed GRA16-GFP protein expression in HCT116-GRA16 cells (
Fig. 1A). Consistent with these findings, in LS174T cells, genomic PCR confirmed vector-derived GFP integration in both vector control and GRA16-expressing cells, whereas GRA16-specific amplification and GRA16-GFP protein expression were detected only in LS174T-GRA16 cells (
Fig. 1B). Fluorescence microscopy demonstrated GFP-positive HCT116 cell populations with Hoechst 33342 nuclear staining (
Fig. 1C). Comparable GFP-positive populations were observed in LS174T cells following Hoechst 33342 nuclear staining (
Fig. 1D).
To assess the impact of GRA16 on CRC cell growth, CCK-8 proliferation assays were conducted over a 96-h time course (
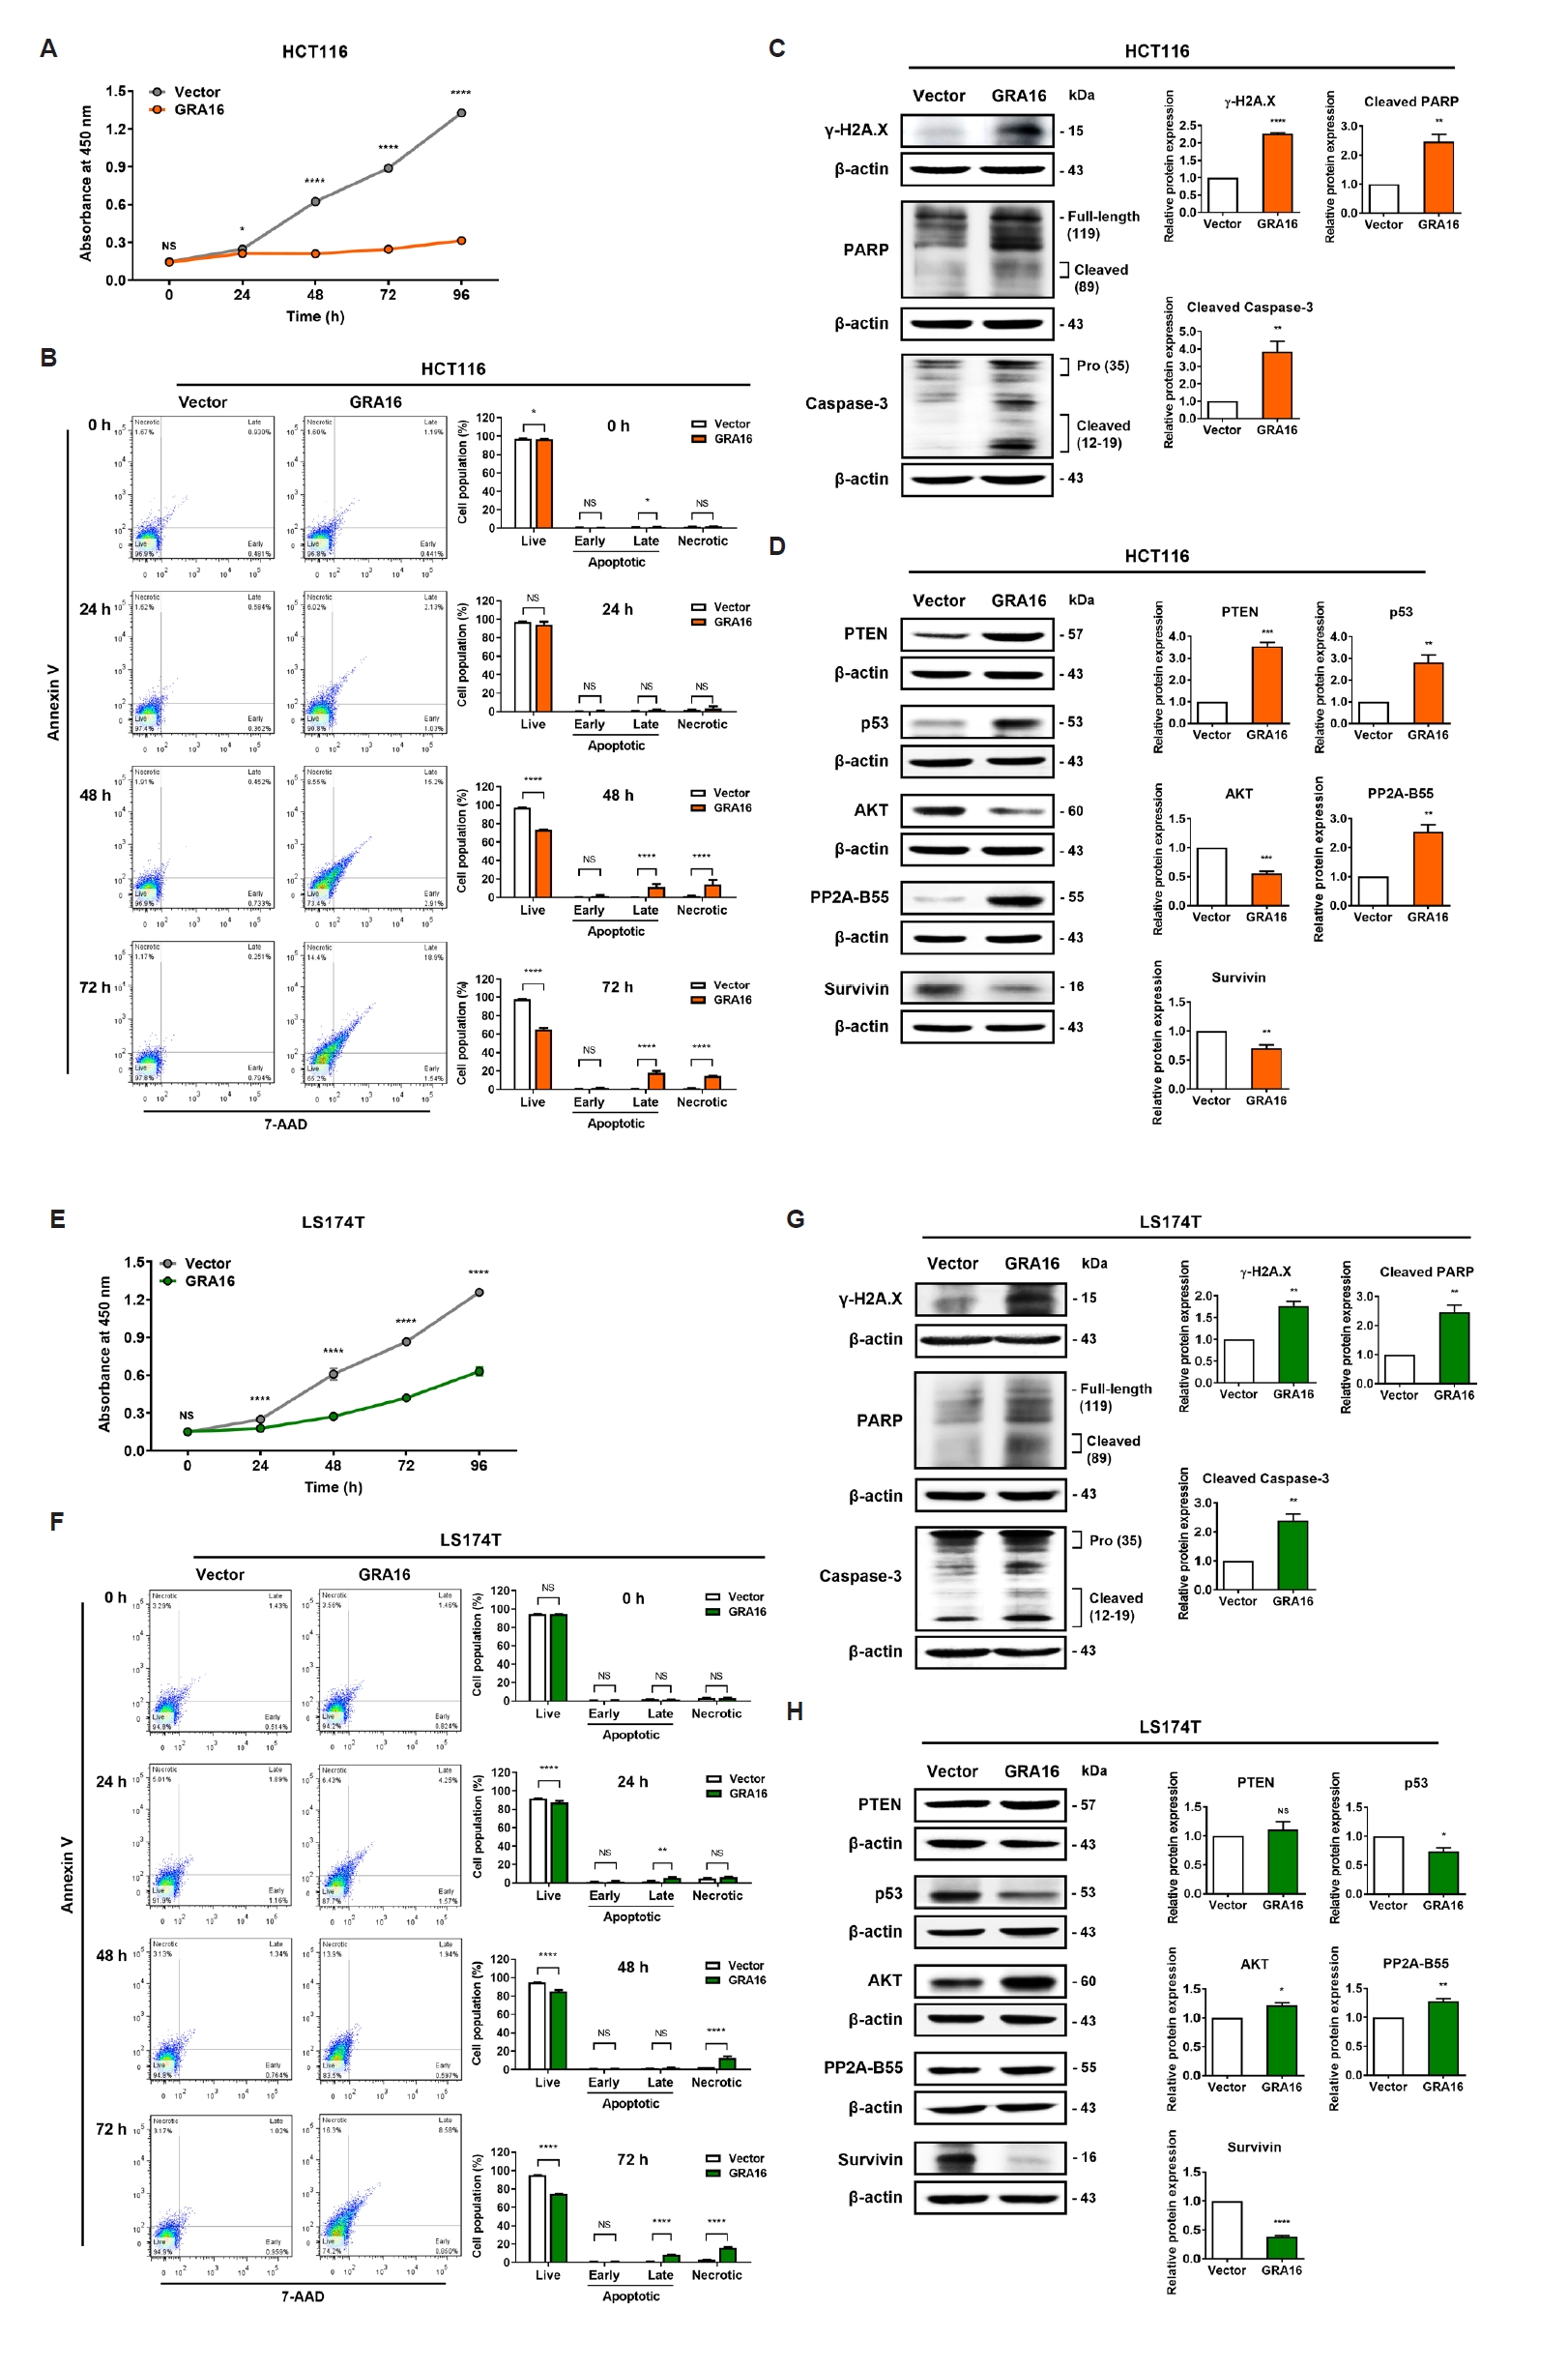
Fig. 2). In HCT116 cells, GRA16 expression significantly inhibited proliferation beginning at 24 h, resulting in a substantially attenuated growth curve compared with vector control cells (
Fig. 2A). GRA16 likewise suppressed the proliferation of KRAS
G12D-mutant LS174T cells throughout the experimental period, although LS174T-GRA16 cells continued to exhibit gradual time-dependent growth (
Fig. 2E).
We next examined the temporal changes in cell death-associated populations using Annexin V/7-AAD flow cytometry at 0, 24, 48, and 72 h. In HCT116 cells, the viable population progressively decreased in GRA16-expressing cells, with pronounced reductions at 48 and 72 h. These changes were accompanied by increases in the late apoptotic and necrotic populations, whereas the early apoptotic population showed no marked change throughout the time course (
Fig. 2B). In LS174T cells, GRA16 expression also reduced the viable population and increased the late apoptotic and necrotic populations in a time-dependent manner, without a prominent increase in the early apoptotic population (
Fig. 2F). These findings indicate that GRA16 induces progressive cell death-associated changes in both cell lines, predominantly involving late apoptotic and 7-AAD–positive populations.
To determine whether the observed cell death-associated changes were accompanied by DNA damage- and apoptosis-related protein alterations, we examined γ-H2A.X, cleaved PARP, and caspase-3 expression by Western blotting. In HCT116-GRA16 cells, γ-H2A.X and the cleaved PARP fragment were significantly increased, together with enhanced caspase-3 cleavage compared with vector control cells (
Fig. 2C). Similarly, LS174T-GRA16 cells exhibited increased γ-H2A.X, cleaved PARP, and cleaved caspase-3 levels, although the magnitude of these changes was generally less pronounced than that observed in HCT116 cells (
Fig. 2G).
To further determine whether the principal transcriptional changes were accompanied by corresponding alterations at the protein level, PTEN, p53, AKT, PP2A-B55, and Survivin were examined by Western blotting. In HCT116-GRA16 cells, PTEN, p53, and PP2A-B55 protein levels were significantly increased, whereas AKT and Survivin protein levels were significantly reduced compared with vector control cells (
Fig. 2D). In LS174T-GRA16 cells, PP2A-B55 protein was significantly increased and Survivin protein was markedly reduced. By contrast, PTEN protein showed no significant change, whereas p53 protein was reduced and AKT protein was increased (
Fig. 2H).
Collectively, these findings demonstrate that GRA16 suppresses proliferation and induces progressive cell death-associated responses in both HCT116 and LS174T cells. The accompanying protein responses differed between the 2 cell lines: HCT116 cells exhibited coordinated increases in PTEN and p53 together with reduced AKT, whereas LS174T cells showed limited PTEN/p53-associated engagement but retained PP2A-B55 induction and Survivin suppression.
GRA16 induces cell line-dependent rewiring of p53-associated anticancer signaling
To define the transcriptional responses linked to GRA16-mediated growth suppression, we analyzed the expression of p53-associated genes involved in apoptosis, cell cycle regulation, epithelial-mesenchymal transition (EMT)/motility, and metabolism by qPCR and grouped the results according to functional modules (
Fig. 3;
Table 2).
Table 2 summarizes representative and functionally informative transcriptional changes within each module.
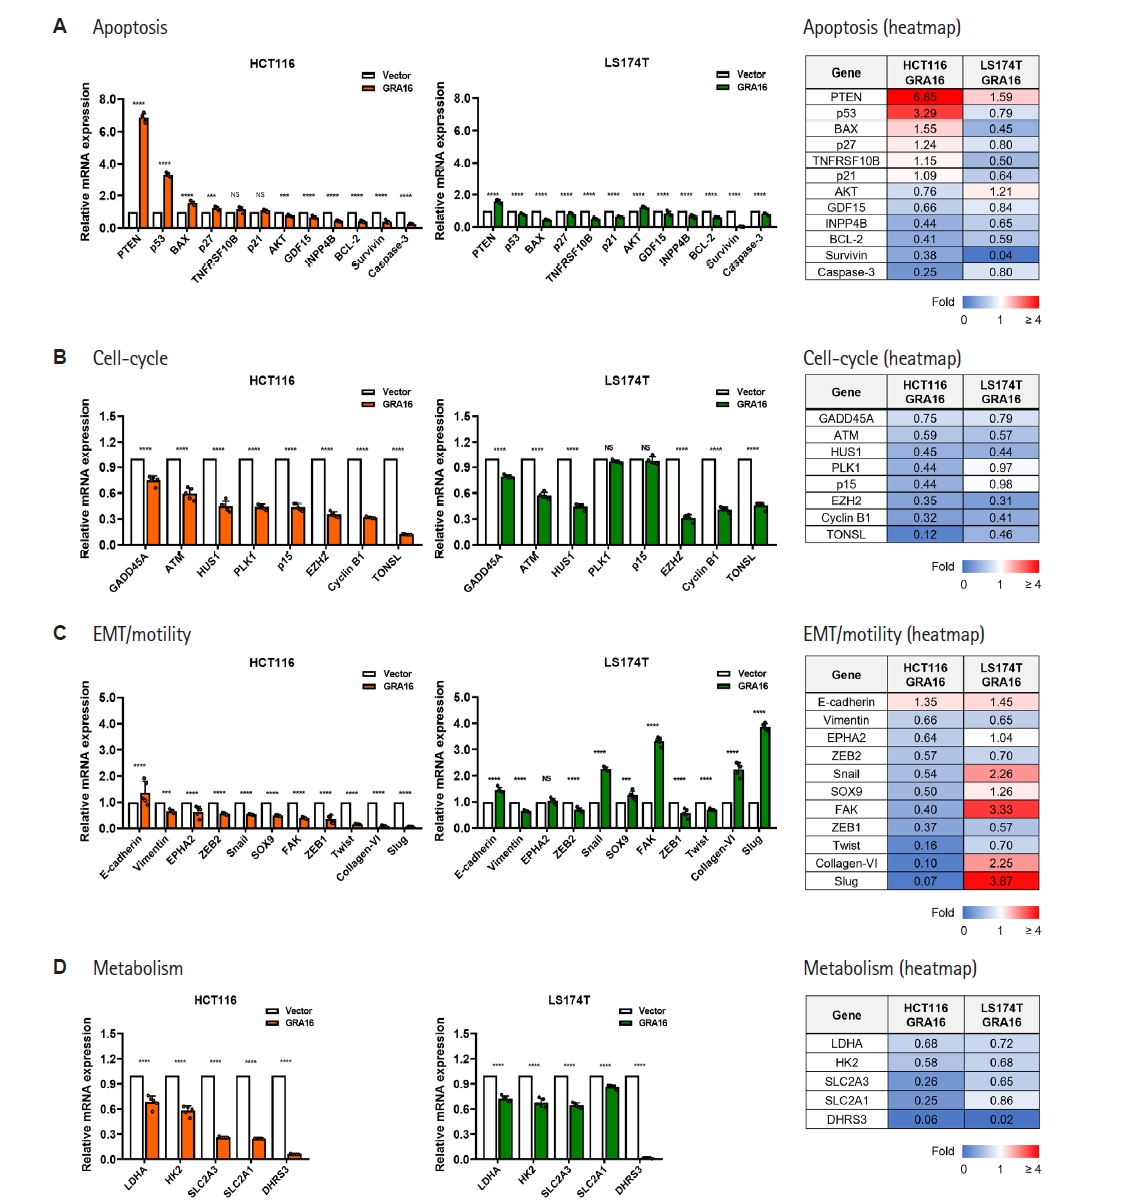
In HCT116-GRA16 cells, GRA16 elicited a coordinated PTEN/p53-centered anticancer transcriptional response. PTEN and p53 transcript levels were markedly increased by 6.85-fold and 3.29-fold, respectively, accompanied by BAX transcript level increase and AKT transcript level decrease (
Fig. 3A;
Table 2). GRA16 also broadly downregulated cell cycle- and checkpoint-associated genes, including ATM, HUS1, PLK1, p15, EZH2, Cyclin B1, and TONSL (
Fig. 3B;
Table 2). Furthermore, EMT/motility-associated markers, including Snail, SOX9, FAK, Collagen-VI, and Slug, as well as glycolysis-associated genes, including LDHA, HK2, SLC2A3, and SLC2A1, were decreased (
Fig. 3C,
D;
Table 2). These transcriptional alterations are consistent with the pronounced growth-suppressive and cell death-associated phenotype observed in HCT116-GRA16 cells.
In KRAS
G12D-mutant LS174T cells, GRA16 induced a distinct yet anticancer-associated transcriptional profile. PTEN transcript level was modestly increased by 1.59-fold, whereas p53/BAX-mediated apoptotic transcription exhibited limited activation (
Fig. 3A;
Table 2). Notably, Survivin transcript level was markedly reduced to 0.04-fold, and multiple glycolysis-associated genes were consistently downregulated, indicating that GRA16 retained anticancer-associated transcriptional changes despite weaker canonical p53/BAX engagement (
Fig. 3A,
D;
Table 2). LS174T-GRA16 cells also exhibited decreased expression of several cell cycle- and checkpoint-associated genes, including ATM, HUS1, EZH2, Cyclin B1, and TONSL (
Fig. 3B;
Table 2).
In contrast to HCT116 cells, LS174T-GRA16 cells exhibited increased expression of selected EMT/motility-associated markers, including Snail, FAK, Collagen-VI, and Slug, whereas several cell cycle-associated genes were downregulated or only modestly altered (
Fig. 3B,
C;
Table 2). Specifically, Snail, FAK, Collagen-VI, and Slug expression increased by 2.26, 3.33, 2.25, and 3.87-fold, respectively, indicating increased expression of selected EMT/motility-associated genes in LS174T cells. Thus, the LS174T response was characterized by the coexistence of anticancer-associated changes, including Survivin suppression and metabolic attenuation, with increased expression of selected EMT/motility-associated transcripts.
Collectively, these data indicate that GRA16 elicits a canonical PTEN/p53-centered anticancer transcriptional response in HCT116 cells, whereas KRASG12D-mutant LS174T cells exhibit a distinct transcriptional response characterized by partial PTEN induction, substantial Survivin suppression, glycolytic attenuation, shared suppression of cell cycle-associated genes, and increased expression of selected EMT/motility-associated transcripts.
GRA16 induces context-dependent PP2A-B55–associated inflammatory and stress-adaptive transcriptional responses
We next analyzed PP2A-B55–associated inflammatory and stress-adaptive gene expression signatures to determine whether GRA16-mediated signaling was preserved or differentially remodeled between HCT116 and LS174T cells (
Fig. 4;
Table 3).
Table 3 presents representative PP2A-B55-associated transcriptional alterations, including fold-change patterns and response directionality.
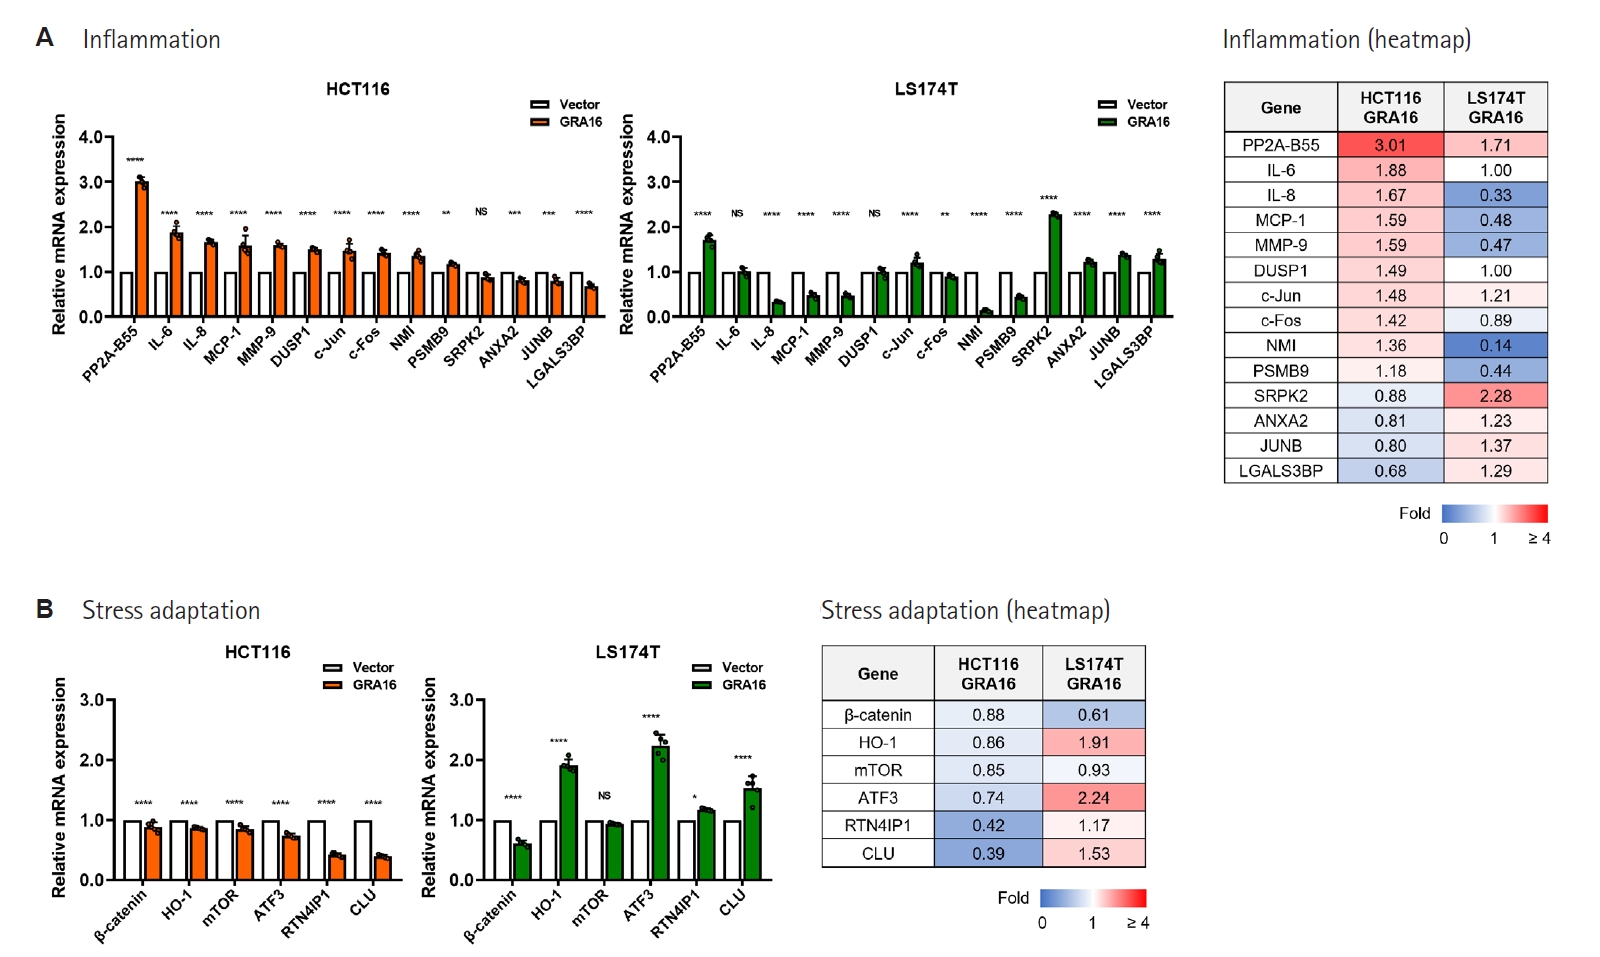
In both HCT116-GRA16 and LS174T-GRA16 cells, PP2A-B55 transcript expression was upregulated, indicating a shared PP2A-B55–associated transcriptional response in both KRAS-mutant CRC cell models (
Fig. 4A;
Table 3). However, downstream inflammatory gene expression patterns differed between the 2 cell lines. In HCT116-GRA16 cells, inflammatory and stress-responsive genes, including IL-8, MCP-1, MMP-9, c-Fos, and NMI, were upregulated, reflecting an inflammatory/stress-associated transcriptional response that accompanied the PTEN/p53-centered anticancer response. In contrast, in LS174T-GRA16 cells, IL-8, MCP-1, MMP-9, and NMI expression were reduced, indicating suppression of selected inflammatory and invasion-associated markers in LS174T cells (
Fig. 4A;
Table 3).
The stress-adaptation module also exhibited a cell line-dependent pattern. In HCT116-GRA16 cells, several stress-adaptive or cytoprotective genes, including ATF3, RTN4IP1, and CLU, were downregulated. In contrast, LS174T-GRA16 cells demonstrated selective induction of HO-1, ATF3, and CLU, accompanied by increased SRPK2 expression in the inflammation-associated module (
Fig. 4B;
Table 3).
Together, these results indicate that GRA16 induces PP2A-B55 expression in both HCT116 and KRASG12D-mutant LS174T cells; however, downstream inflammatory and stress-adaptive outputs are context-dependent. In LS174T cells, suppression of selected inflammatory/invasion-associated transcripts coexisted with increased expression of selected stress-adaptive genes, indicating a transcriptional pattern distinct from the HCT116 response.
Integrated interpretation of GRA16-induced response patterns in HCT116 and LS174T cells
To integrate the observed phenotypic, protein-marker, and transcriptional changes induced by GRA16, we summarized the dominant response patterns across apoptosis, cell-cycle regulation, EMT/motility-associated transcription, metabolism, inflammation, and stress adaptation (
Table 4). In HCT116 cells, GRA16 elicited a canonical PTEN/p53-centered anticancer response characterized by apoptosis-associated transcriptional and protein-marker activation, robust cell-cycle suppression, EMT/motility marker downregulation, metabolic attenuation, and inflammatory activation.
In LS174T cells, GRA16 induced a response pattern that differed from that observed in HCT116 cells. This response was characterized by protein-marker activation with attenuated or divergent p53-associated transcription, broad cell cycle-associated suppression, metabolic attenuation, PP2A-B55 induction, and reduced expression of selected inflammatory/invasion-associated markers. LS174T cells additionally exhibited increased expression of selected EMT/motility-associated transcripts and strong stress-adaptive remodeling, suggesting that the GRA16 response in this cellular context diverges from the canonical PTEN/p53-centered program observed in HCT116 cells.
Collectively, these findings indicate that GRA16 induces anticancer-associated responses in both TP53-wild-type KRAS-mutant CRC cell lines, whereas the accompanying transcriptional patterns differ between HCT116 and LS174T cells (
Table 4). These data further suggest that GRA16 responsiveness is preserved in KRAS
G12D-mutant LS174T cells, although the comparatively attenuated response in LS174T cells was associated with limited p53/BAX-mediated transcription despite PTEN- and PP2A-B55-associated changes.
Discussion
This study shows that GRA16 induces anticancer-associated responses in both HCT116 and KRASG12D-mutant LS174T cells, accompanied by distinct transcriptional patterns. In HCT116 cells, GRA16 induced a canonical PTEN/p53-associated anticancer response characterized by strong PTEN and p53 upregulation, proliferation suppression, EMT/motility marker downregulation, glycolytic gene inhibition, increased cell death-associated populations, and elevated protein levels of γ-H2A.X, cleaved PARP, and cleaved caspase-3. The observed increases in γ-H2A.X and cleaved caspase-3 further indicate that the GRA16-induced transcriptional changes are accompanied by DNA damage-associated and apoptotic signaling pathways at the protein level.
In LS174T cells, GRA16 also inhibited proliferation and increased cell death-associated populations, accompanied by elevated levels of DNA damage- and apoptosis-associated protein markers; however, the associated transcriptional program differed from the canonical PTEN/p53-centered pattern observed in HCT116 cells. Importantly, increased γ-H2A.X and cleaved caspase-3 expression in LS174T-GRA16 cells suggests that the cell death-associated phenotype was accompanied by corresponding protein-level changes despite limited engagement of canonical p53/BAX-dependent apoptotic transcription. This LS174T response included partial PTEN induction, significant Survivin suppression, glycolytic attenuation, PP2A-B55 induction, attenuation of selected inflammatory/invasion-associated markers, and stress-adaptive remodeling.
In HCT116 cells, the GRA16-induced transcriptional profile was consistent with the established host-modulatory biology of GRA16. Independent work originally identified GRA16 as an exported
T. gondii dense granule effector that translocates to the host nucleus, interacts with HAUSP/USP7 and PP2A, modulates p53 protein levels, and alters host transcriptional programs, including p53-regulated genes [
15]. Consistent with this independent evidence, our previous study further showed that GRA16 promotes PTEN nuclear localization and augments p53-dependent apoptotic signaling in p53-competent cancer cells [
11]. In this study, HCT116-GRA16 cells demonstrated marked induction of PTEN and p53, along with BAX upregulation and suppression of AKT and multiple cell cycle-associated genes. These molecular changes were associated with the pronounced growth-suppressive and cell death-associated phenotype observed in HCT116 cells and are consistent with enhanced PTEN/p53-associated tumor-suppressive responses. Given that AKT signaling promotes MDM2-dependent p53 degradation, modulation of the PTEN/AKT/p53 axis remains a plausible central mechanism underlying the strong GRA16 response in this cell line [
9,
16].
By contrast, KRAS
G12D-mutant LS174T cells exhibited limited activation of the canonical p53/BAX-centered apoptotic transcriptional program despite retaining wild-type TP53. This observation is consistent with previous reports suggesting that LS174T cells may preferentially undergo sustained cell cycle arrest rather than robust apoptosis following SN-38-induced stress [
17]. In the present study, GRA16 increased PTEN and PP2A-B55 expression in LS174T cells, whereas p53- and BAX-associated transcriptional induction remained limited. Thus, the comparatively attenuated cell death-associated response observed in LS174T cells cannot be attributed specifically to the KRAS
G12D mutation. Rather, it may reflect broader cell line-intrinsic differences affecting the relationship between PTEN-, PP2A-B55-, and p53/BAX-associated responses.
Importantly, limited p53/BAX transcriptional engagement did not indicate loss of GRA16 responsiveness. LS174T-GRA16 cells still showed suppression of cell-cycle/checkpoint-associated and glycolysis-associated genes, which may explain why GRA16 reduced proliferation and increased cell death-associated populations despite attenuated p53/BAX-centered apoptotic transcription.
Among these alternative routes, Survivin suppression may be of particular relevance. Survivin is a key regulator of apoptosis inhibition and mitotic regulation and is widely recognized as a cancer-associated therapeutic target [
18]. Therefore, the marked reduction of Survivin in LS174T-GRA16 cells may contribute to growth suppression despite limited p53/BAX activation. Furthermore, glycolysis-associated genes, including LDHA, HK2, SLC2A3, and SLC2A1, were downregulated in both HCT116 and LS174T cells. Independent evidence has also implicated GRA16 in
T. gondii-mediated upregulation of host c-Myc, supporting the broader ability of GRA16 to modulate host transcriptional and metabolic programs [
19]. Because metabolic reprogramming and aerobic glycolysis support CRC growth and therapeutic resistance, this preserved metabolic attenuation may reflect a shared GRA16-associated anticancer mechanism across KRAS-mutant CRC models [
20,
21].
The EMT/motility-associated transcriptional response differed between the 2 cell lines. In HCT116-GRA16 cells, GRA16 downregulated multiple EMT/motility-associated transcripts. EMT promotes CRC progression, metastasis, and therapeutic resistance, and transcription factors such as Snail and Slug play central roles in EMT-associated processes [
22,
23]. In LS174T-GRA16 cells, however, selected EMT/motility-associated transcripts, including Slug, FAK, Snail, and Collagen-VI, were increased. Because these findings were derived from gene-expression analyses, they should not be interpreted as direct evidence of altered migratory or invasive behavior. Rather, they indicate that growth-suppressive and cell death-associated responses in LS174T cells coexisted with a divergent EMT/motility-associated transcriptional pattern.
GRA16 also induced PP2A-B55 expression in both cell lines, supporting PP2A-B55 induction as a shared molecular response. Previous research has shown that GRA16 suppresses nuclear factor-κB activation through PP2A-B55 upregulation in non-small-cell lung carcinoma cells [
12]. In the present CRC models, however, downstream inflammatory and stress-adaptive outputs varied between cell lines. In LS174T-GRA16 cells, expression of selected inflammatory/invasion-associated markers such as IL-8, MCP-1, and MMP-9 was reduced, while HO-1, ATF3, and CLU, which are associated with stress-response, cytoprotective, or therapy-adaptive states in CRC, were selectively upregulated [
24-
26]. Thus, LS174T cells appear to respond to GRA16 through a mixed transcriptional state in which anticancer-associated alterations coexist with stress-adaptive remodeling.
Taken together, these findings support a model in which GRA16-mediated anticancer activity is strongly influenced by cellular context. HCT116 cells exhibited a coherent PTEN/p53-centered anticancer response, whereas LS174T cells displayed a distinct response characterized by partial PTEN induction, Survivin suppression, metabolic attenuation, PP2A-B55 induction, inflammatory/invasion marker attenuation, and stress-adaptive remodeling. This interpretation is consistent with the broader concept that KRAS-mutant CRC represents a molecularly heterogeneous disease in which therapeutic responses may be influenced by multiple genetic and cell line-intrinsic factors [
3,
4]. Given the limited therapeutic options for KRAS
G12D-mutant CRC, GRA16 may provide a useful parasite-derived experimental framework for investigating anticancer responses in KRAS-mutant CRC, including KRAS
G12D-mutant models [
27].
An additional limitation concerns the use of stable lentiviral GRA16 expression as an effector-focused experimental model. During
T. gondii infection, GRA16 is secreted from parasite dense granules and exported beyond the parasitophorous vacuole into host cellular compartments, where it can modulate host signaling and gene expression [
10,
11]. In contrast, the present system provides sustained intracellular GRA16 expression and bypasses parasite invasion, parasitophorous vacuole formation, physiological effector export, and the combined influence of other parasite-derived molecules and infection-associated host responses. Accordingly, this model is useful for isolating GRA16-associated host-cell effects but does not reproduce the full biological context of
T. gondii infection. Future studies using parasite infection models will be required to determine whether the responses observed here are reproduced under the physiological context of
T. gondii infection.
An important limitation of this study is that HCT116 and LS174T are independently derived CRC cell lines that differ in multiple genetic and biological characteristics in addition to their KRAS mutations. Therefore, the differences observed between HCT116 and LS174T cannot be attributed specifically to KRASG13D versus KRASG12D. In the present study, the KRAS genotypes serve as relevant molecular characteristics of the selected cell models rather than isolated experimental variables. Additional studies using multiple cell lines carrying the same KRAS variant or isogenic models differing only at the KRAS locus will be required to determine whether KRAS codon identity directly influences the response to GRA16.
A further limitation is that the present study does not establish the causal requirement of the PTEN/p53 axis for the GRA16-induced phenotypes. Although PTEN- and p53-associated changes were observed together with growth suppression and increased cell death-associated populations, these findings demonstrate association rather than functional necessity. Genetic or pharmacological perturbation studies, including PTEN or p53 knockdown, knockout, or rescue experiments, will be required to determine whether either factor is necessary for the GRA16-induced response.
Future studies should further clarify how these transcriptional changes translate into functional signaling outcomes. Although this study validated γ-H2A.X, cleaved PARP, cleaved caspase-3, PTEN, p53, AKT, PP2A-B55, and Survivin at the protein level, the present analyses assessed protein abundance rather than phosphorylation status, enzymatic activity, subcellular localization, or causal pathway dependence. Further functional validation of these signaling nodes and protein-level validation of additional stress-adaptive markers will be necessary to delineate the molecular basis of the context-dependent GRA16 response. Although the time-course Annexin V/7-AAD analysis demonstrated progressive cell death-associated changes in LS174T cells, the present study did not directly assess cell-cycle distribution or alternative cell death pathways. Furthermore, additional phenotype-level validation of apoptosis-, cell cycle-, and EMT/motility-associated responses, together with validation in additional KRAS
G12D-mutant CRC models and more complex experimental systems, would help evaluate the translational potential of GRA16 as a parasite-derived anticancer effector candidate [
28].
In conclusion, this study demonstrates that GRA16 elicits anticancer responses both in KRASG13D-mutant HCT116 cells and KRASG12D-mutant LS174T cells. HCT116 cells exhibit a canonical PTEN/p53-centered anticancer program, whereas LS174T cells demonstrate a distinct response characterized by growth suppression, cell death-associated changes, partial PTEN induction, Survivin suppression, metabolic attenuation, PP2A-B55 induction, and stress-adaptive remodeling. These findings support GRA16 as a parasite-derived anticancer effector candidate in KRAS-mutant CRC models and indicate that its effects are accompanied by cell line-dependent differences in PTEN-, PP2A-B55-, and p53/BAX-associated responses.
Notes
-
Data availability
The datasets used and/or analyzed in this study are available from the corresponding author and can be provided on reasonable request.
-
Author contributions
Conceptualization: Seo SH, Ahn SH, Shin EH. Data curation: Seo SH, Lee JE, Ahn SH, Shin EH. Funding acquisition: Shin EH, Seo SH. Investigation: Lee JE, Ahn SH, Cho EJ. Methodology: Seo SH, Lee JE, Ahn SH, Cho EJ. Writing – original draft: Seo SH. Writing – review & editing: Seo SH, Shin EH.
-
Conflict of interest
Eun-Hee Shin serves as an editor of Parasites, Hosts and Diseases but had no involvement in the decision to publish this article. No other potential conflicts of interest relevant to this study were reported.
-
Funding
This work was supported by the National Research Foundation of Korea (NRF) grant funded by the Korea government (Ministry of Science and ICT, MSIT) (IRIS No. RS-2025-00516274 and RS-2025-00559259) and by grant No. 14-2025-0027 from the Seoul National University Bundang Hospital Research Fund.
-
Acknowledgments
The authors acknowledge the use of a generative artificial intelligence tool solely for language editing and improvement of manuscript readability.
Fig. 1.Establishment and validation of stable Toxoplasma gondii dense granule protein 16 (GRA16)-expressing HCT116 and LS174T colorectal cancer cell lines. Stable GRA16-expressing and vector control HCT116 and LS174T cells were generated through recombinant lentiviral transduction. Genomic PCR and Western blot analyses were performed to confirm lentiviral transgene integration and GRA16-GFP protein expression in (A) HCT116 and (B) LS174T cells. Genomic PCR was conducted using primer sets specific for vector-derived GFP and GRA16. The green fluorescent protein (GFP)-specific product was detected in both vector control and GRA16-expressing cells, whereas the GRA16-specific product was detected exclusively in GRA16-expressing cells. Western blotting using an anti-GFP antibody confirmed GRA16-GFP protein expression in GRA16-expressing cells. β-actin was employed as a loading control. Representative bright-field and fluorescence microscopy images of (C) HCT116 and (D) LS174T cells. Hoechst 33342 was used for nuclear staining, and GFP fluorescence indicates lentiviral vector-derived GFP expression. M, marker; Vp, vector primer; Gp, GRA16 primer. Scale bars=100 μm. Representative genomic PCR gel images are shown to confirm lentiviral transgene integration. Anti-GFP Western blotting and fluorescence microscopy were performed using 3 independent biological replicates per condition, and representative images are shown.
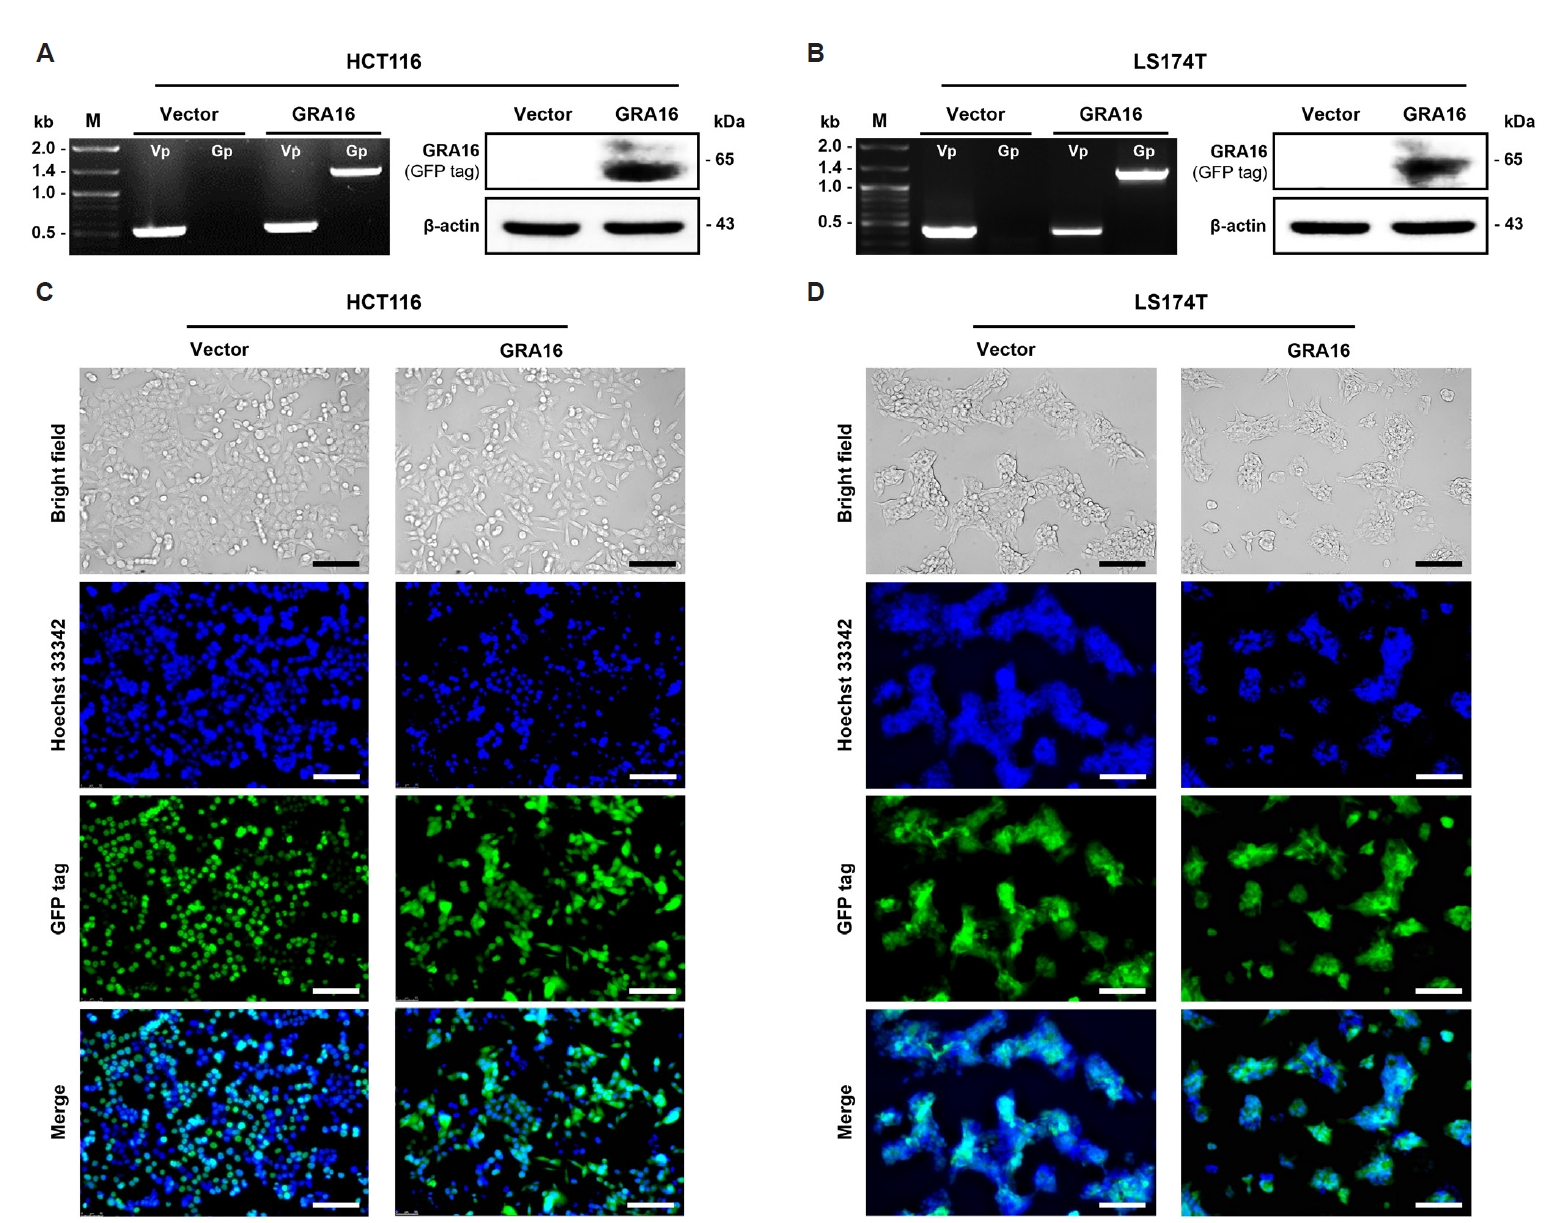
Fig. 2.
Toxoplasma gondii dense granule protein 16 (GRA16) suppresses proliferation and induces cell death-associated responses in HCT116 and LS174T colorectal cancer cell lines. Cell proliferation, time-dependent (A) CCK-8 proliferation assay in HCT116 cells over a 96-h time course, with absorbance measured at 450 nm. (B) Annexin V/7-AAD flow cytometric analysis of HCT116 cells at 0, 24, 48, and 72 h. Viable, early apoptotic, late apoptotic, and necrotic cell populations were quantified. (C) Western blot analysis of γ-H2A.X, PARP, and caspase-3 in HCT116 cells. (D) Western blot analysis of PTEN, p53, AKT, PP2A-B55, and Survivin in HCT116 cells.(E) CCK-8 proliferation assay in LS174T cells over a 96-h time course, with absorbance measured at 450 nm. (F) Annexin V/7-AAD flow cytometric analysis of LS174T cells at 0, 24, 48, and 72 h. (G) Western blot analysis of γ-H2A.X, PARP, and caspase-3 in LS174T cells. (H) Western blot analysis of PTEN, p53, AKT, PP2A-B55, and Survivin in LS174T cells. Full-length PARP was detected at approximately 119 kDa, whereas cleaved PARP was detected at approximately 89 kDa. The cleaved PARP band was used for densitometric quantification. The approximately 35-kDa band represents pro-caspase-3, whereas immunoreactive bands within the approximately 12–19 kDa range represent cleaved caspase-3 forms. The cleaved caspase-3 immunoreactive bands were used for densitometric quantification. β-actin was used as a loading control. Band intensities were normalized to β-actin, and relative protein expression was calculated by setting the corresponding vector control group to 1. Data are expressed as the mean±SD. CCK-8 data represent 5 independent biological replicates per condition. Flow cytometric analyses and Western blot quantification were performed using 3 independent biological replicates per condition. CCK-8 and flow cytometric data were analyzed using two-way analysis of variance followed by Šídák’s multiple comparisons test. Western blot densitometric data were examined using unpaired two-tailed Student t-test. Adjusted P-values were used to ascertain statistical significance where applicable. NS, not significant. *P<0.05, **P<0.01, ***P<0.001, and ****P<0.0001.
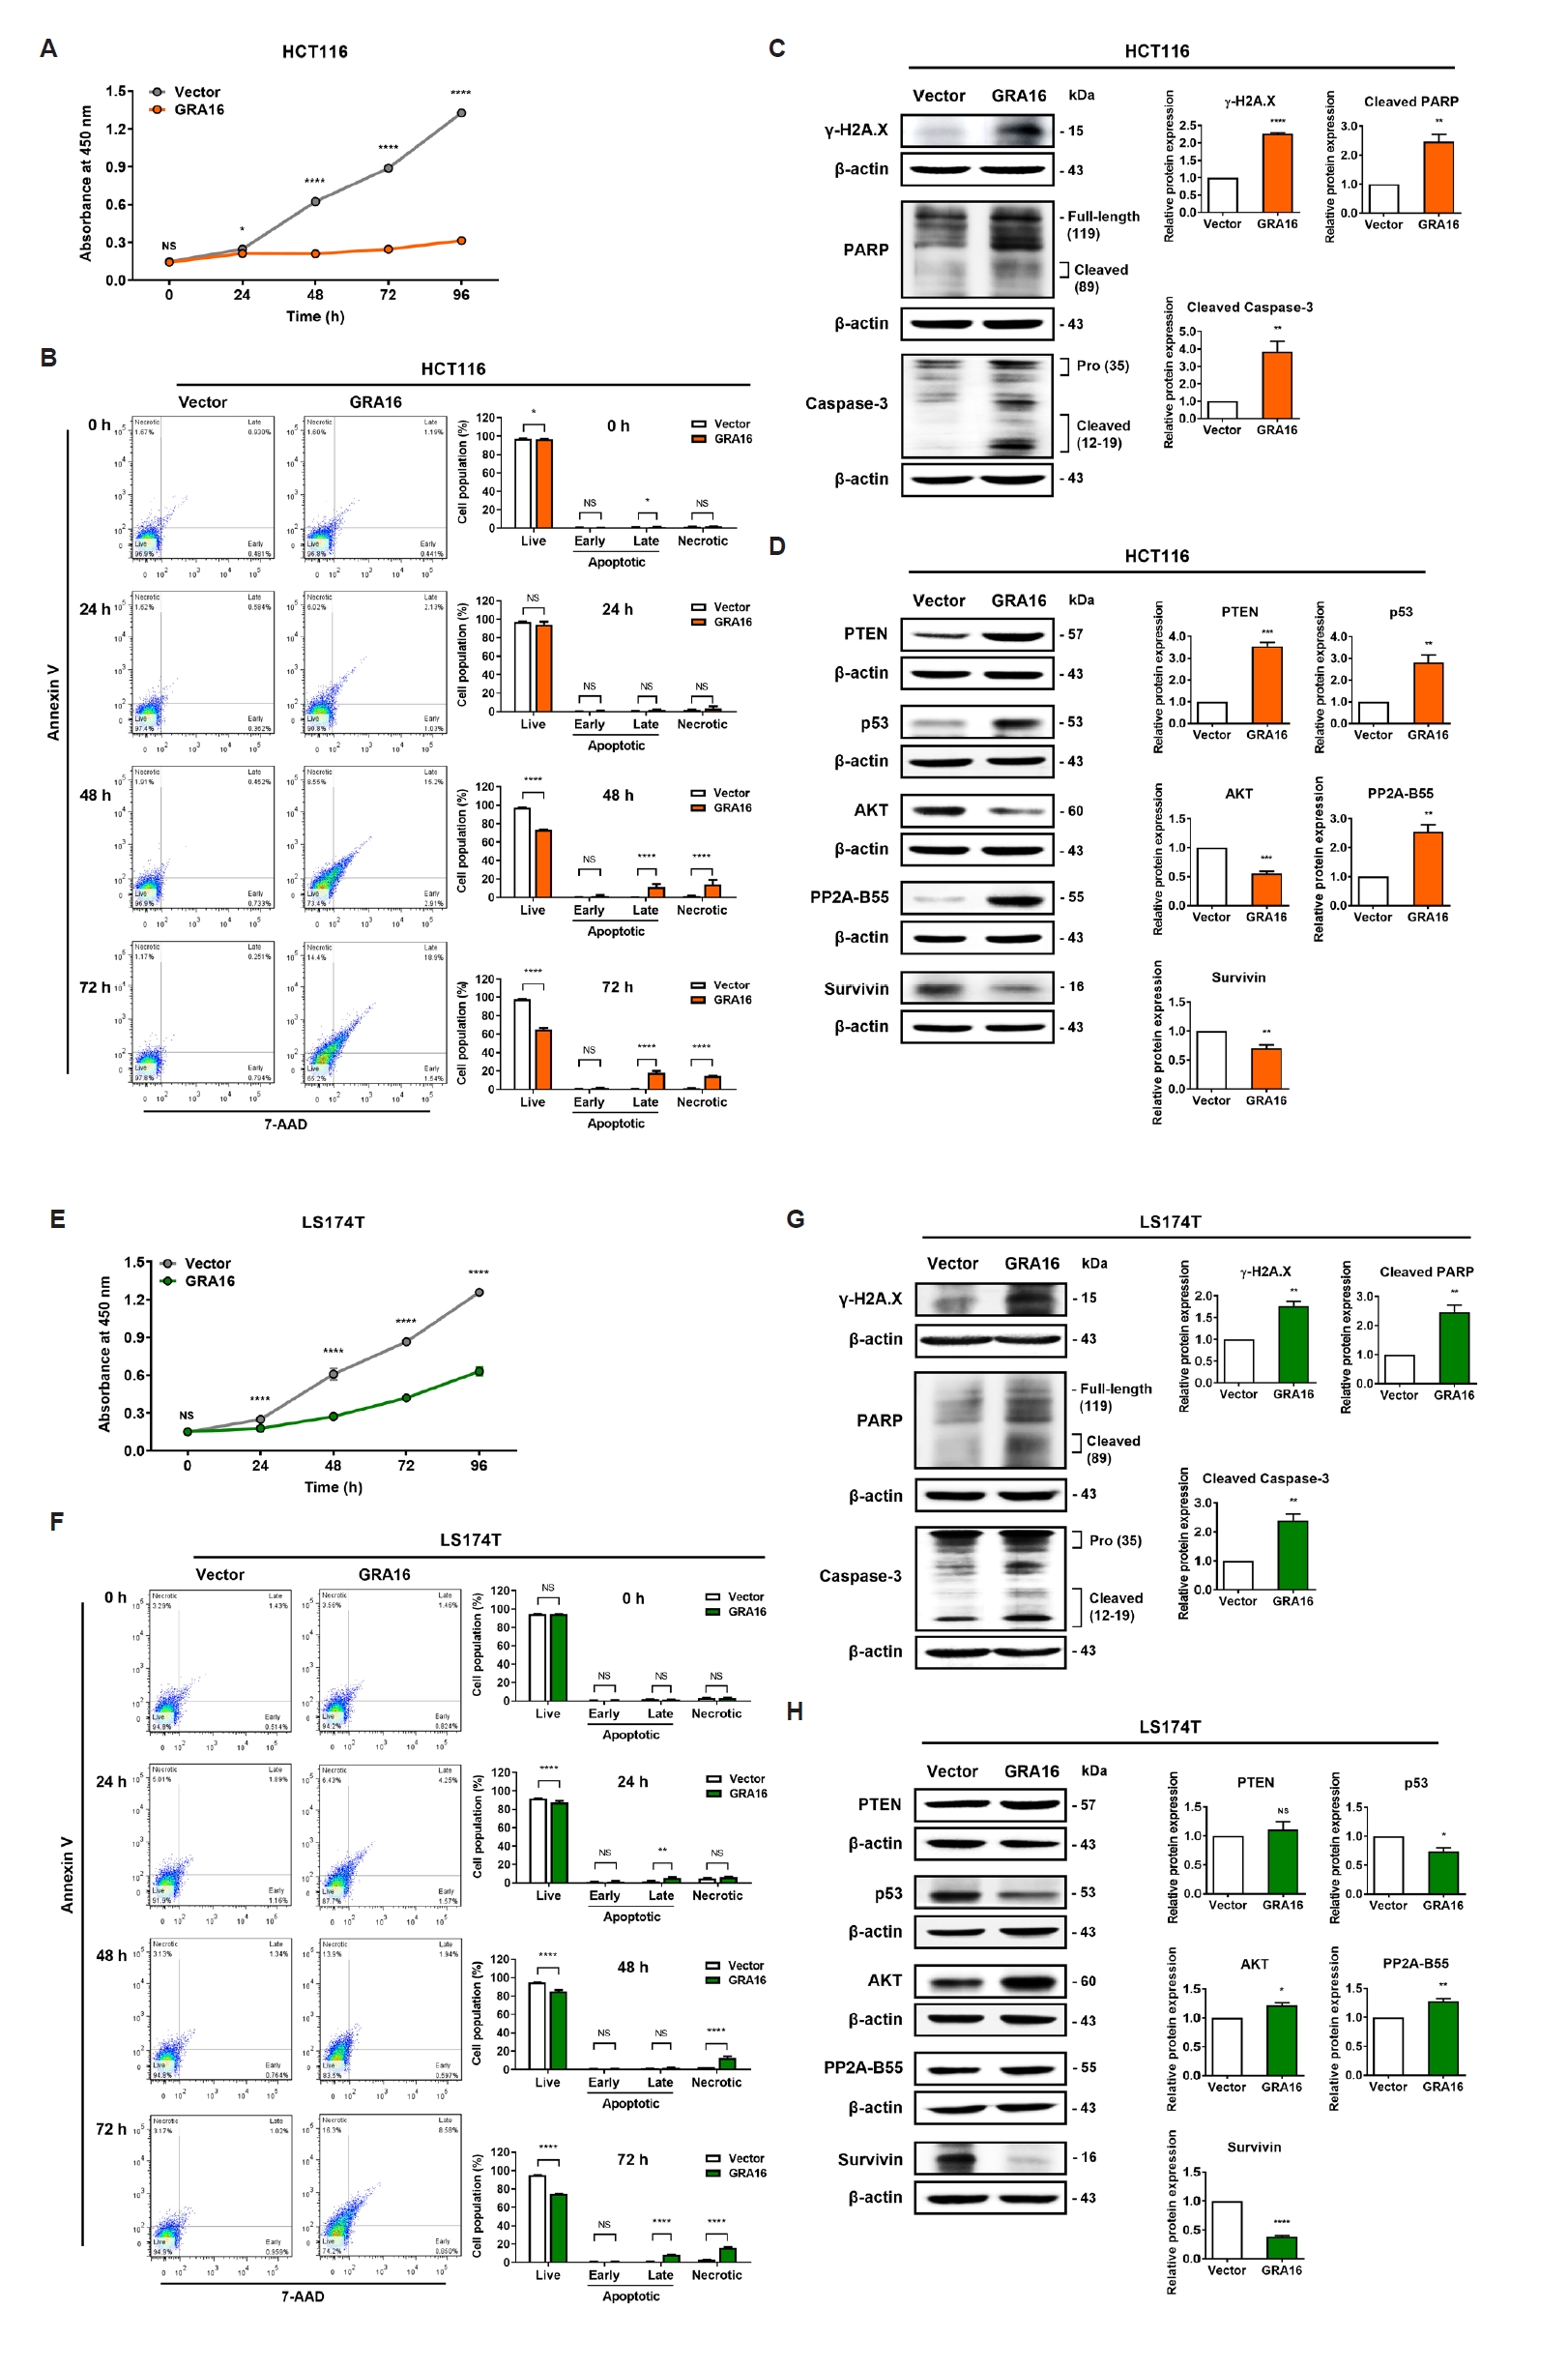
Fig. 3.
Toxoplasma gondii dense granule protein 16 (GRA16) induces cell line-dependent rewiring of p53-associated anticancer transcriptional programs in HCT116 and LS174T colorectal cancer cell lines. Quantitative PCR analysis was performed to evaluate the expression of p53-associated genes involved in apoptosis, cell-cycle regulation, epithelial mesenchymal transition/motility, and metabolism in stable vector control and GRA16-expressing HCT116 and LS174T cells. (A) Apoptosis-associated gene expression and corresponding heatmap. (B) Cell cycle- and checkpoint-associated gene expression and the corresponding heatmap. (C) Epithelial mesenchymal transition/motility-associated gene expression and corresponding heatmap. (D) Metabolism-associated gene expression and corresponding heatmap. Relative gene expression was assessed using the 2−ΔΔCt method, with the corresponding vector control group set to 1.0 for each cell line. Heatmaps display relative mRNA expression in GRA16-expressing cells after normalization to GAPDH and to the corresponding vector control, which was set to 1. Blue indicates decreased expression, white indicates expression equivalent to the vector control, and red indicates increased expression. The color scale ranges from 0 to 4, with values ≥4 displayed at the maximum red intensity. Data are expressed as the mean±SD of 5 independent biological replicates per condition. For each gene, GRA16-expressing cells were compared with the corresponding vector control within each cell line using one-way analysis of variance followed by Šídák’s multiple comparisons test. Adjusted P-values were used to determine statistical significance. NS, not significant; *P<0.05, **P<0.01, ***P<0.001, and ****P<0.0001.
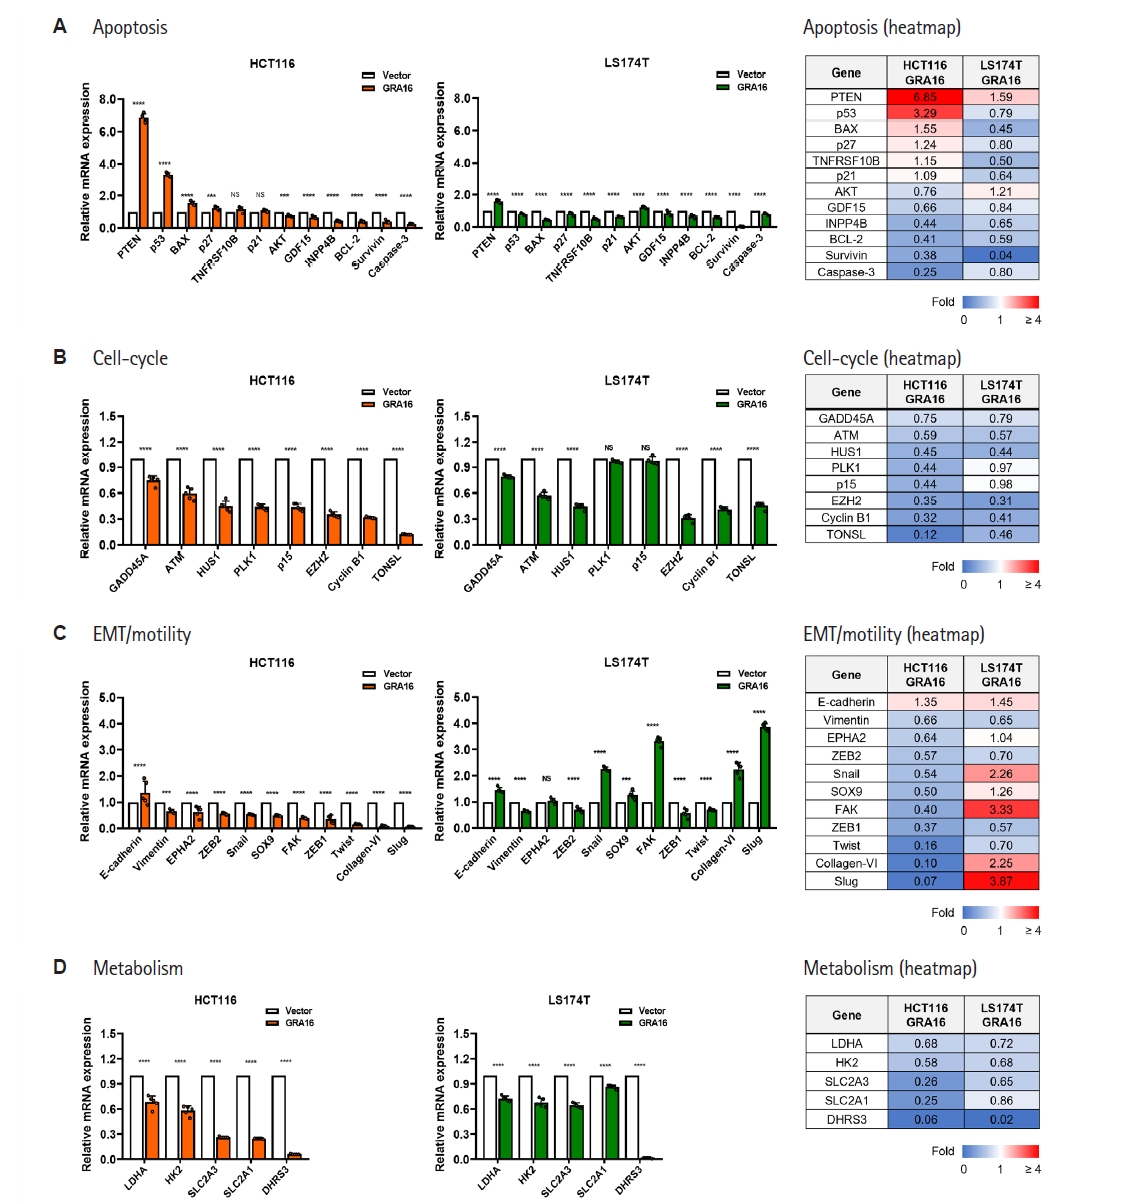
Fig. 4.
Toxoplasma gondii dense granule protein 16 (GRA16) elicits context-dependent protein phosphatase 2A-B55 (PP2A-B55)–associated inflammatory and stress-adaptive transcriptional responses in HCT116 and LS174T colorectal cancer cell lines. Quantitative PCR analysis was performed to assess PP2A-B55–associated inflammatory and stress-adaptive genes in stable vector control and GRA16-expressing HCT116 and LS174T cells. (A) Inflammation-associated gene expression and corresponding heatmap. (B) Stress adaptation-associated gene expression and corresponding heatmap. Relative gene expression was determined using the 2−ΔΔCt method, with the corresponding vector control group set to 1.0 for each cell line. Heatmaps display relative mRNA expression in GRA16-expressing cells after normalization to GAPDH and to the corresponding vector control, which was set to 1. Blue indicates decreased expression, white indicates expression equivalent to the vector control, and red indicates increased expression. The color scale ranges from 0 to 4, with values ≥4 displayed at the maximum red intensity. Data are expressed as the mean±SD of 5 independent biological replicates per condition. For each gene, GRA16-expressing cells were compared with the corresponding vector control within each cell line using one-way ANOVA followed by Šídák’s multiple comparisons test. Adjusted P-values were used to determine statistical significance. NS, not significant; *P<0.05, **P<0.01, ***P<0.001, and ****P<0.0001.
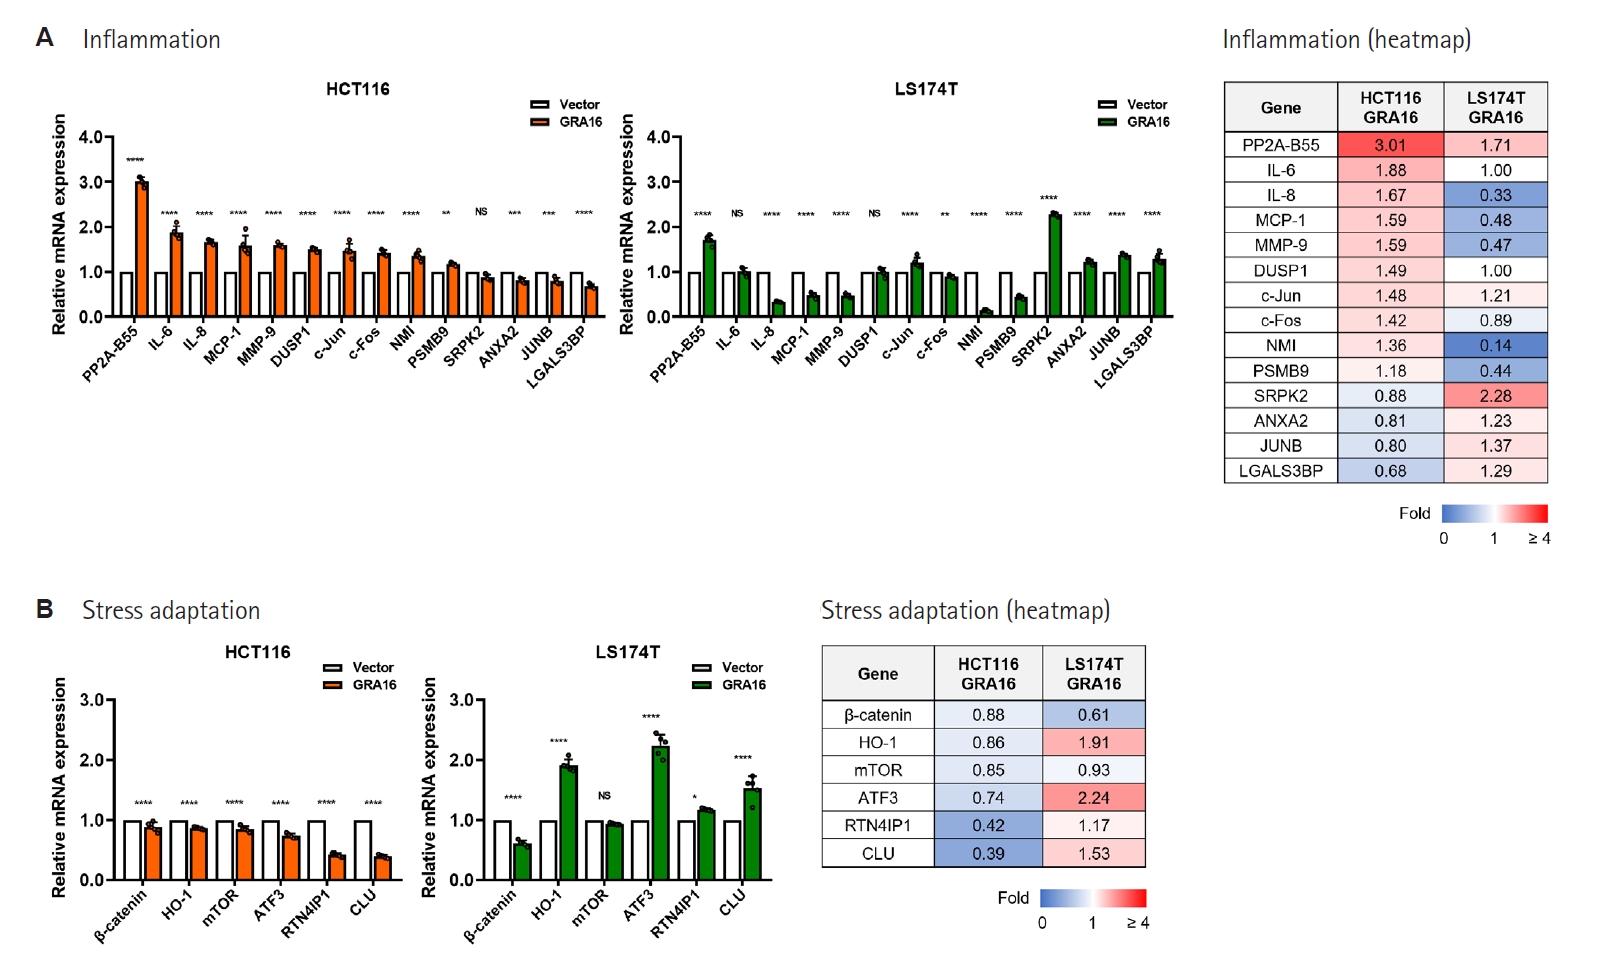
Table 1.Primer sequences used for genomic PCR and quantitative PCR analyses
Table 1.
|
Gene |
Forward primer (5’→3’) |
Reverse primer (5’→3’) |
|
GFP
|
GTGCTCAGGTAGTGGTTGTC |
TGAAGTTCATCTGCACCACC |
|
GRA16
|
ATGTATCGAAACCACTCAGGG |
TCACATCTGATCATTTTTCCGC |
|
PTEN
|
TGAGTTCCCTCAGCCGTTACCT |
GAGGTTTCCTCTGGTCCTGGTA |
|
p53
|
CCTCAGCATCTTATCCGAGTGG |
TGGATGGTGGTACAGTCAGAGC |
|
BAX
|
TCAGGATGCGTCCACCAAGAAG |
TGTGTCCACGGCGGCAATCATC |
|
p27
|
ATAAGGAAGCGACCTGCAACCG |
TTCTTGGGCGTCTGCTCCACAG |
|
TNFRSF10B
|
AGCACTCACTGGAATGACCTCC |
GTGCCTTCTTCGCACTGACACA |
|
p21
|
AGGTGGACCTGGAGACTCTCAG |
TCCTCTTGGAGAAGATCAGCCG |
|
AKT
|
TGGACTACCTGCACTCGGAGAA |
GTGCCGCAAAAGGTCTTCATGG |
|
GDF15
|
CAACCAGAGCTGGGAAGATTCG |
CCCGAGAGATACGCAGGTGCA |
|
INPP4B
|
CAGTAGCAAGGATGGAGAGGCA |
TTGCTCGGTTCACCACTTCTCC |
|
BCL-2
|
ATCGCCCTGTGGATGACTGAGT |
GCCAGGAGAAATCAAACAGAGGC |
|
Survivin
|
CCACTGAGAACGAGCCAGACTT |
GTATTACAGGCGTAAGCCACCG |
|
Caspase-3
|
GGAAGCGAATCAATGGACTCTGG |
GCATCGACATCTGTACCAGACC |
|
GADD45A
|
CTGGAGGAAGTGCTCAGCAAAG |
AGAGCCACATCTCTGTCGTCGT |
|
ATM
|
TGTTCCAGGACACGAAGGGAGA |
CAGGGTTCTCAGCACTATGGGA |
|
HUS1
|
GAGCCTTGAAGACTGCCCAGAA |
GGTCACAATGCGGCTACTGCTT |
|
PLK1
|
GCACAGTGTCAATGCCTCCAAG |
GCCGTACTTGTCCGAATAGTCC |
|
p15
|
ACGGAGTCAACCGTTTCGGGAG |
GGTCGGGTGAGAGTGGCAGG |
|
EZH2
|
GACCTCTGTCTTACTTGTGGAGC |
CGTCAGATGGTGCCAGCAATAG |
|
Cyclin B1
|
GACCTGTGTCAGGCTTTCTCTG |
GGTATTTTGGTCTGACTGCTTGC |
|
TONSL
|
ACTACTGTGGCTGGACACCTCT |
CACAGTTGAGGGCATCGTGGAG |
|
E-cadherin
|
GCCTCCTGAAAAGAGAGTGGAAG |
TGGCAGTGTCTCTCCAAATCCG |
|
Vimentin
|
AGGCAAAGCAGGAGTCCACTGA |
ATCTGGCGTTCCAGGGACTCAT |
|
EPHA2
|
ACTGCCAGTGTCAGCATCAACC |
GTGACCTCGTACTTCCACACTC |
|
ZEB2
|
AATGCACAGAGTGTGGCAAGGC |
CTGCTGATGTGCGAACTGTAGG |
|
Snail
|
TGCCCTCAAGATGCACATCCGA |
GGGACAGGAGAAGGGCTTCTC |
|
SOX9
|
AGGAAGCTCGCGGACCAGTAC |
GGTGGTCCTTCTTGTGCTGCAC |
|
FAK
|
GCCTTATGACGAAATGCTGGGC |
CCTGTCTTCTGGACTCCATCCT |
|
ZEB1
|
GGCATACACCTACTCAACTACGG |
TGGGCGGTGTAGAATCAGAGTC |
|
Twist
|
GCCAGGTACATCGACTTCCTCT |
TCCATCCTCCAGACCGAGAAGG |
|
Collagen-VI
|
GCCTTCCTGAAGAATGTCACCG |
TCCAGCAGGATGGTGATGTCAG |
|
Slug
|
ATCTGCGGCAAGGCGTTTTCCA |
GAGCCCTCAGATTTGACCTGTC |
|
LDHA
|
GATTCCGGATCTCATTGCCAC |
TGGAACCAAAAGGAATCGGG |
|
HK2
|
GAGTTTGACCTGGATGTGGTTGC |
CCTCCATGTAGCAGGCATTGCT |
|
SLC2A3
|
GCTGGGCATCGTTGTTGGA |
GCACTTTGTAGGATAGCAGGAAG |
|
SLC2A1
|
GGCCAAGAGTGTGCTAAAGAA |
ACAGCGTTGATGCCAGACAG |
|
DHRS3
|
GGGCACTGAGTGCCATTACTTC |
CGGCATTGTTCACCAGGATGGT |
|
PP2A-B55
|
GCAACAGGAGATAAAGGTGGTAG |
TGGTTCATGGCTCTGGAAGGTG |
|
IL-6
|
AGACAGCCACTCACCTCTTCAG |
TTCTGCCAGTGCCTCTTTGCTG |
|
IL-8
|
GAGAGTGATTGAGAGTGGACCAC |
CACAACCCTCTGCACCCAGTTT |
|
MCP-1
|
AGAATCACCAGCAGCAAGTGTCC |
TCCTGAACCCACTTCTGCTTGG |
|
MMP-9
|
GCCACTACTGTGCCTTTGAGTC |
CCCTCAGAGAATCGCCAGTACT |
|
DUSP1
|
CAACCACAAGGCAGACATCAGC |
GTAAGCAAGGCAGATGGTGGCT |
|
c-Jun
|
CCTTGAAAGCTCAGAACTCGGAG |
TGCTGCGTTAGCATGAGTTGGC |
|
c-Fos
|
GCCTCTCTTACTACCACTCACC |
AGATGGCAGTGACCGTGGGAAT |
|
NMI
|
GAAACGGAGTTACAAGAGGCTAC |
GACAACTGGCTGTCATTCTCAGG |
|
PSMB9
|
CGAGAGGACTTGTCTGCACATC |
CACCAATGGCAAAAGGCTGTCG |
|
SRPK2
|
ACATCTGGAGCACGGCGTGTAT |
CCAGATAGAGCAAAGTGCCTTGG |
|
ANXA2
|
TCGGACACATCTGGTGACTTCC |
CCTCTTCACTCCAGCGTCATAG |
|
JUNB
|
CGATCTGCACAAGATGAACCACG |
CTGCTGAGGTTGGTGTAAACGG |
|
LGALS3BP
|
GGCAGCAATGTCACCATGAGTG |
GTGGAAGCACTTGACTGACGAC |
|
β-catenin
|
CACAAGCAGAGTGCTGAAGGTG |
GATTCCTGAGAGTCCAAAGACAG |
|
HO-1
|
CCAGGCAGAGAATGCTGAGTTC |
AAGACTGGGCTCTCCTTGTTGC |
|
mTOR
|
AGCATCGGATGCTTAGGAGTGG |
CAGCCAGTCATCTTTGGAGACC |
|
ATF3
|
CGCTGGAATCAGTCACTGTCAG |
CTTGTTTCGGCACTTTGCAGCTG |
|
RTN4IP1
|
GGAGTCACTGTAGGTTCAAAGGC |
CTTTCCCGCATCCACCAGTTCT |
|
CLU
|
TGCGGATGAAGGACCAGTGTGA |
TTTCCTGGTCAACCTCTCAGCG |
|
GAPDH
|
GTCTCCTCTGACTTCAACAGCG |
ACCACCCTGTTGCTGTAGCCAA |
Table 2.Cell line-dependent rewiring of representative p53-associated anticancer signaling by GRA16
Table 2.
|
Functional module |
Gene |
HCT116 (GRA16/vector) |
LS174T (GRA16/vector) |
Response pattern |
Potential biological implication based on transcript-level changes |
Response interpretation |
|
Apoptosis |
PTEN
|
6.85 ↑↑↑ |
1.59 ↑ |
Common (HCT116-dominant) |
Tumor-suppressive signaling enhancement/AKT restraint |
Consistent |
|
p53
|
3.29 ↑↑ |
0.79 ↓ |
Opposite response |
HCT116: p53 activation |
Divergent |
|
LS174T: limited p53 transcriptional engagement |
|
BAX
|
1.55 ↑ |
0.45 ↓ |
Opposite response |
HCT116: apoptosis promotion |
Divergent |
|
LS174T: attenuated p53/BAX apoptotic transcription |
|
p27
|
1.24 ↑ |
0.80 ↓ |
Opposite response |
HCT116: proliferative arrest |
Divergent |
|
LS174T: attenuated growth-inhibitory response |
|
AKT
|
0.76 ↓ |
1.21 ↑ |
Opposite response |
HCT116: survival signaling suppression |
Divergent |
|
LS174T: survival-associated transcriptional change |
|
Survivin
|
0.38 ↓ |
0.04 ↓↓↓ |
Common (LS174T-dominant) |
Anti-apoptotic/mitotic survival marker suppression |
Consistent |
|
Cell-cycle |
ATM
|
0.59 ↓ |
0.57 ↓ |
Common |
Reduced DNA damage checkpoint/cell-cycle-associated transcription |
Consistent |
|
HUS1
|
0.45 ↓ |
0.44 ↓ |
Common |
Suppressed checkpoint-associated transcription |
Consistent |
|
EZH2
|
0.35 ↓ |
0.31 ↓ |
Common |
Reduced proliferative/epigenetic regulatory marker expression |
Consistent |
|
Cyclin B1
|
0.32 ↓ |
0.41 ↓ |
Common |
Reduced mitotic cell-cycle-associated transcription |
Consistent |
|
TONSL
|
0.12 ↓↓↓ |
0.46 ↓ |
Common (HCT116-dominant) |
Reduced replication stress/DNA repair-associated transcription |
Consistent |
|
EMT/motility |
Snail
|
0.54 ↓ |
2.26 ↑↑ |
Opposite response |
HCT116: EMT suppression |
Strongly divergent |
|
LS174T: EMT-associated transcriptional activation |
|
SOX9
|
0.50↓ |
1.26 ↑ |
Opposite response |
HCT116: reduced stemness/invasion |
Divergent |
|
LS174T: modest increase in EMT/stemness-associated transcription |
|
FAK
|
0.40 ↓ |
3.33 ↑↑ |
Opposite response |
HCT116: adhesion/motility suppression |
Strongly divergent |
|
LS174T: increased motility-associated markers |
|
Collagen-VI
|
0.10 ↓↓↓ |
2.25 ↑↑ |
Opposite response |
HCT116: ECM/motility restraint |
Strongly divergent |
|
LS174T: increased ECM-associated marker expression |
|
Slug
|
0.07 ↓↓↓ |
3.87 ↑↑ |
Opposite response |
HCT116: EMT inhibition |
Strongly divergent |
|
LS174T: EMT-associated transcriptional activation |
|
Metabolism |
LDHA
|
0.68 ↓ |
0.72 ↓ |
Common |
Glycolytic restriction |
Consistent |
|
HK2
|
0.58 ↓ |
0.68 ↓ |
Common |
Reduced glucose-utilizing survival metabolism |
Consistent |
|
SLC2A3
|
0.26 ↓↓ |
0.65 ↓ |
Common (HCT116-dominant) |
Reduced glucose uptake capacity |
Consistent |
|
SLC2A1
|
0.25 ↓↓ |
0.86 ↓ |
Common (HCT116-dominant) |
Suppressed glycolytic substrate influx |
Consistent |
Table 3.Context-dependent modulation of representative PP2A-B55–associated inflammatory and stress-adaptive genes by GRA16
Table 3.
|
Functional module |
Gene |
HCT116 (GRA16/vector) |
LS174T (GRA16/vector) |
Response pattern |
Potential biological implication based on transcript-level changes |
Response interpretation |
|
Inflammation |
PP2A-B55
|
3.01 ↑↑ |
1.71 ↑ |
Common (HCT116-dominant) |
Core phosphatase axis engaged in both cell lines |
Common molecular response |
|
IL-8
|
1.67 ↑ |
0.33 ↓ |
Opposite response |
HCT116: pro-inflammatory recruitment |
Divergent |
|
LS174T: inflammatory attenuation |
|
MCP-1
|
1.59 ↑ |
0.48 ↓ |
Opposite response |
HCT116: monocyte-recruiting tumor-supportive signaling |
Divergent |
|
LS174T: reduced inflammatory recruitment |
|
MMP-9
|
1.59 ↑ |
0.47 ↓ |
Opposite response |
HCT116: ECM remodeling/invasion support |
Divergent |
|
LS174T: reduced invasion-associated marker expression |
|
c-Fos
|
1.42 ↑ |
0.89 ↓ |
HCT116-dominant increase |
HCT116: stress/inflammatory transcriptional activation |
Context-dependent |
|
NMI
|
1.36 ↑ |
0.14 ↓↓ |
Opposite response |
HCT116: cytokine-response engagement |
Divergent |
|
LS174T: markedly reduced inflammatory signaling |
|
SRPK2
|
0.88 - |
2.28 ↑↑ |
LS174T-dominant increase |
LS174T: inflammation-associated stress-signaling adaptation |
LS174T-adaptive |
|
JUNB
|
0.80 ↓ |
1.37 ↑ |
Opposite response |
HCT116: reduced inflammatory transcription |
Divergent |
|
LS174T: transcriptional adaptation |
|
Stress adaptation |
HO-1
|
0.86 - |
1.91 ↑ |
LS174T-dominant increase |
LS174T: oxidative stress-associated adaptive response |
LS174T-adaptive |
|
ATF3
|
0.74 ↓ |
2.24 ↑↑ |
Opposite response |
HCT116: reduced adaptive stress response |
LS174T-adaptive |
|
LS174T: marked stress-adaptive transcriptional response |
|
RTN4IP1
|
0.42 ↓ |
1.18 ↑ |
Opposite response |
HCT116: reduced mitochondrial support |
Divergent |
|
LS174T: mitochondrial adaptive maintenance |
|
CLU
|
0.39 ↓ |
1.53 ↑ |
Opposite response |
HCT116: reduced cytoprotective buffering |
LS174T-adaptive |
|
LS174T: cytoprotective marker induction |
Table 4.Integrated interpretation of context-dependent anticancer responses induced by GRA16 in KRAS-mutant colorectal cancer cells
Table 4.
|
Functional module |
HCT116 (KRASG13D) |
LS174T (KRASG12D) |
Integrated interpretation in cancer |
|
Apoptotic response |
Strongly activated at transcriptional and protein-marker levels |
Protein-marker activation with attenuated/divergent p53-associated transcription |
HCT116-biased anticancer program |
|
Cell-cycle response |
Strongly suppressed |
Broadly suppressed |
Common cell-cycle-associated growth-suppressive response |
|
EMT/motility response |
Strongly suppressed |
Increased expression of selected EMT/motility-associated transcripts |
Divergent EMT/motility-associated transcript pattern |
|
Metabolic response |
Commonly suppressed |
Commonly suppressed |
Common anti-metabolic effect |
|
Inflammatory response |
Strongly activated |
Attenuated or divergent |
Divergent inflammatory remodeling |
|
Stress adaptation (Cytoprotection) |
Decreased |
Strongly activated |
LS174T-biased stress-adaptive transcriptional program |
|
Consequence of GRA16 |
Prominent PTEN/p53-associated anticancer response |
Partial anticancer output with limited p53/BAX transcriptional engagement |
The magnitude of the GRA16-associated anticancer response differed according to the accompanying PTEN/PP2A-B55- and p53/BAX-associated response patterns |
References
- 1. Bray F, Laversanne M, Sung H, et al. Global cancer statistics 2022: GLOBOCAN estimates of incidence and mortality worldwide for 36 cancers in 185 countries. CA Cancer J Clin 2024;74:229-63. https://doi.org/10.3322/caac.21834
- 2. Fearon ER, Vogelstein B. A genetic model for colorectal tumorigenesis. Cell 1990;61:759-67. https://doi.org/10.1016/0092-8674(90)90186-I
- 3. Takeda M, Yoshida S, Inoue T, et al. The role of KRAS mutations in colorectal cancer: biological insights, clinical implications, and future therapeutic perspectives. Cancers (Basel) 2025;17:428. https://doi.org/10.3390/cancers17030428
- 4. Navarro-Jiménez M, González B, Mulet N, Hierro C, Alonso S. KRAS-targeted therapies in colorectal cancer: a systematic analysis of mutations, inhibitors, and clinical trials. NPJ Precis Oncol 2025;9:380. https://doi.org/10.1038/s41698-025-01166-3
- 5. Zhu G, Pei L, Ye D, et al. Targeting KRAS in colorectal cancer immunotherapy: rationale, challenges and future directions. Biochim Biophys Acta Rev Cancer 2025;1880:189382. https://doi.org/10.1016/j.bbcan.2025.189382
- 6. U.S. Food and Drug Administration. FDA grants accelerated approval to adagrasib with cetuximab for KRAS G12C-mutated colorectal cancer [Internet]. 2024 Jun 21 [cited 2026 May 7]. Available from: https://www.fda.gov/drugs/resources-information-approved-drugs/fda-grants-accelerated-approval-adagrasib-cetuximab-kras-g12c-mutated-colorectal-cancer
- 7. U.S. Food and Drug Administration. FDA approves sotorasib with panitumumab for KRAS G12C-mutated colorectal cancer [Internet]. 2025 Jan 16 [cited 2026 May 7]. Available from: https://www.fda.gov/drugs/resources-information-approved-drugs/fda-approves-sotorasib-panitumumab-kras-g12c-mutated-colorectal-cancer
- 8. Choucair K, Imtiaz H, Uddin MH, et al. Targeting KRAS mutations: orchestrating cancer evolution and therapeutic challenges. Signal Transduct Target Ther 2025;10:385. https://doi.org/10.1038/s41392-025-02473-8
- 9. Ogawara Y, Kishishita S, Obata T, et al. Akt enhances Mdm2-mediated ubiquitination and degradation of p53. J Biol Chem 2002;277:21843-50. https://doi.org/10.1074/jbc.M109745200
- 10. Bougdour A, Tardieux I, Hakimi MA. Toxoplasma exports dense granule proteins beyond the vacuole to the host cell nucleus and rewires the host genome expression. Cell Microbiol 2014;16:334-43. https://doi.org/10.1111/cmi.12255
- 11. Kim SG, Seo SH, Shin JH, et al. Increase in the nuclear localization of PTEN by the Toxoplasma GRA16 protein and subsequent induction of p53-dependent apoptosis and anticancer effect. J Cell Mol Med 2019;23:3234-45. https://doi.org/10.1111/jcmm.14207
- 12. Seo SH, Kim SG, Shin JH, Ham DW, Shin EH. Toxoplasma GRA16 inhibits NF-κB activation through PP2A-B55 upregulation in non-small-cell lung carcinoma cells. Int J Mol Sci 2020;21:6642. https://doi.org/10.3390/ijms21186642
- 13. Seo SH, Shin JH, Ham DW, Shin EH. PTEN/AKT signaling pathway related to hTERT downregulation and telomere shortening induced in Toxoplasma GRA16-expressing colorectal cancer cells. Biomed Pharmacother 2022;153:113366. https://doi.org/10.1016/j.biopha.2022.113366
- 14. Lee JE, Seo SH, Ham DW, Shin EH. Toxoplasma gondii GRA16 suppresses aerobic glycolysis by downregulating c-Myc and TERT expressions in colorectal cancer cells. Biomol Ther (Seoul) 2025;33:621-35. https://doi.org/10.4062/biomolther.2025.040
- 15. Bougdour A, Durandau E, Brenier-Pinchart MP, et al. Host cell subversion by Toxoplasma GRA16, an exported dense granule protein that targets the host cell nucleus and alters gene expression. Cell Host Microbe 2013;13:489-500. https://doi.org/10.1016/j.chom.2013.03.002
- 16. Mello SS, Attardi LD. Deciphering p53 signaling in tumor suppression. Curr Opin Cell Biol 2018;51:65-72. https://doi.org/10.1016/j.ceb.2017.11.005
- 17. te Poele RH, Joel SP. Schedule-dependent cytotoxicity of SN-38 in p53 wild-type and mutant colon adenocarcinoma cell lines. Br J Cancer 1999;81:1285-93. https://doi.org/10.1038/sj.bjc.6694370
- 18. Siragusa G, Tomasello L, Giordano C, Pizzolanti G. Survivin (BIRC5): implications in cancer therapy. Life Sci 2024;350:122788. https://doi.org/10.1016/j.lfs.2024.122788
- 19. Panas MW, Boothroyd JC. Toxoplasma uses GRA16 to upregulate host c-Myc. mSphere 2020;5:e00402-20. https://doi.org/10.1128/msphere.00402-20
- 20. Pang B, Wu H. Metabolic reprogramming in colorectal cancer: a review of aerobic glycolysis and its therapeutic implications for targeted treatment strategies. Cell Death Discov 2025;11:321. https://doi.org/10.1038/s41420-025-02623-5
- 21. Zhong X, He X, Wang Y, et al. Warburg effect in colorectal cancer: the emerging roles in tumor microenvironment and therapeutic implications. J Hematol Oncol 2022;15:160. https://doi.org/10.1186/s13045-022-01358-5
- 22. Nie F, Sun X, Sun J, Zhang J, Wang Y. Epithelial-mesenchymal transition in colorectal cancer metastasis and progression: molecular mechanisms and therapeutic strategies. Cell Death Discov 2025;11:336. https://doi.org/10.1038/s41420-025-02593-8
- 23. Bao Z, Zeng W, Zhang D, et al. SNAIL induces EMT and lung metastasis of tumours secreting CXCL2 to promote the invasion of M2-type immunosuppressed macrophages in colorectal cancer. Int J Biol Sci 2022;18:2867-81. https://doi.org/10.7150/ijbs.66854
- 24. Fahrer J, Wittmann S, Wolf AC, Kostka T. Heme oxygenase-1 and its role in colorectal cancer. Antioxidants (Basel) 2023;12:1989. https://doi.org/10.3390/antiox12111989
- 25. Lu X, Zhong L, Lindell E, et al. Identification of ATF3 as a novel protective signature of quiescent colorectal tumor cells. Cell Death Dis 2023;14:676. https://doi.org/10.1038/s41419-023-06204-1
- 26. Hlavca S, Chan WH, Engel RM, Abud HE. Clusterin: a marker and mediator of chemoresistance in colorectal cancer. Cancer Metastasis Rev 2024;43:379-91. https://doi.org/10.1007/s10555-024-10173-y
- 27. Wu X, Hayashi H, Tanizaki T, Sun Y, Iwatsuki M. Emerging KRAS G12D inhibitor in the treatment of digestive system tumors: opportunities and challenges. Transl Gastroenterol Hepatol 2026;11:49. https://doi.org/10.21037/tgh-25-124
- 28. Zhang Y, Meng R, Sha D, et al. Advances in the application of colorectal cancer organoids in precision medicine. Front Oncol 2024;14:1506606. https://doi.org/10.3389/fonc.2024.1506606