Abstract
Biomphalaria alexandrina snails play an indispensable role in transmission of schistosomiasis. Infection rates in field populations of snails are routinely determined by cercarial shedding neglecting prepatent snail infections, because of lack of a suitable method for diagnosis. The present study aimed at separation and quantification of oxalic, malic, acetic, pyruvic, and fumaric acids using ion-suppression reversed-phase high performance liquid chromatography (HPLC) to test the potentiality of these acids to be used as diagnostic and therapeutic biomarkers. The assay was done in both hemolymph and digestive gland-gonad complex (DGG) samples in a total of 300 B. alexandrina snails. All of the studied acids in both the hemolymph and tissue samples except for the fumaric acid in hemolymph appeared to be good diagnostic biomarkers as they provide not only a good discrimination between the infected snails from the control but also between the studied stages of infection from each other. The most sensitive discriminating acid was malic acid in hemolymph samples as it showed the highest F-ratio. Using the Z-score, malic acid was found to be a good potential therapeutic biomarker in the prepatency stage, oxalic acid and acetic acid in the stage of patency, and malic acid and acetic acid at 2 weeks after patency. Quantification of carboxylic acids, using HPLC strategy, was fast, easy, and accurate in prediction of infected and uninfected snails and possibly to detect the stage of infection. It seems also useful for detection of the most suitable acids to be used as drug targets.
-
Key words: Schistosoma mansoni, carboxylic acid, biomarker, snail, Biomphalaria, HPLC
INTRODUCTION
Fresh water pulmonate snails of the genus
Biomplalaria are best known for their role as intermediate hosts of the widely distributed parasite,
Schistosoma mansoni [
1]. This parasite, one of the causal agents of the debilitating disease (intestinal schistosomiasis), infects 207 million people worldwide and puts an estimate of 779 million people at risk of acquiring infection [
2]. One of the keys to understand the present and future of
Schistosoma mansoni infection in Egypt is to understand more about the snails that play an indispensable role in its transmission [
3].
Parasitic helminths have an absolute dependency on carbohydrates for their energy source, and one of the key features of carbohydrate catabolism is the excretion of a wide range of carboxylic acids. However, most of them have low molecular absorptivity and thus are poorly detectable compounds by photometric detection [
4].
The depletion of energy sources and alterations in the carbohydrate metabolism caused by the trematode larvae on their snail intermediate host was thought to be similar to that observed during estivation in which food uptake ceases, water loss occurs, and gas exchange may also be affected. All of these alterations exert an influence on the snail's metabolism which may be reflected in the concentration of metabolites resembling consumption of host metabolites by the developing parasites [
5]. Becker [
5] stated that starvation of
Biomphalaria glabrata for 6 days was equivalent to 30 days' infection by
S. mansoni. Several studies have demonstrated that infected schistosome vectors grow faster and have a greater soft tissue mass than their unparasitized counterparts [
6]. This appears inconsistent with the starvation hypothesis. Moreover, it was recently reported that the adenylate energy charge of the digestive gland-gonad tissue complex (DGG), unlike in estivation, is affected very little by infection. Thus, the infected snail appears to undergo some degree of physiological adaptation to the parasitized state. The finding that snail hosts have the potential for regulating hemolymph carbohydrate level indicates that host metabolic responses to infection are compensatory and aimed at maintaining blood glucose in response to continuous utilization by developing parasite [
7].
Biomarkers of diseases refer to cellular, biochemical, or molecular alterations that occur during diseases and could be measured in biological matrices, such as tissue, cells, or fluids [
8,
9]. Over the last several years, researchers have started to explore the new array based technologies to map biomarkers of diseases and to identify targets for drug design that promise to provide signatures that are characteristics for each disease state by taking snap shot of metabolism [
10]. Enhancement of our current understanding of a host's metabolic response to a parasitic infection is a promising approach for biomarker identification, yet its potential for diagnosis and disease surveillance has been under used [
11].
Combining several biomarkers has been shown to improve the discriminatory capability considerably. Recent developments in the field of metabolomics now provide the tools to go one step further; identify profiles of metabolites that together serve as a biomarker [
12]. The present study was initiated from this assumption and designed to identify a biomarker profile that could distinguish uninfected from infected snails and potentially to differentiate between the stages of infection. A profile of selected carboxylic acids was done using the malic, pyruvic, and fumaric acids as representatives of carbohydrate intermediary metabolism of both aerobic and anaerobic pathways which are directly linked to energy production and facultative metabolic ways in both the snail and the parasite [
13-
15]. Whereas, acetic and oxalic acids represent the end product of carbohydrate metabolism [
14,
15].
Studies on such acids as biomarkers in
Biomphalaria snails after infection with
S. mansoni may be important in developing rational methods to diagnose infection, control, and even eradicate medically important snails that transmit parasitic diseases to humans and animals [
16].
MATERIALS AND METHODS
Biological materials were achieved from the Medical Malacology Laboratory, Theodor Bilharz Research Institute, Imbaba, Egypt, using Egyptian strains. A total of 300 snails were used in this study; 150 cases and 150 controls.
Snail maintenance
Snails were maintained in plastic trays each containing 10 snails and 1 liter of aerated tap water 26 ± 2℃, replaced twice a week and fed boiled fresh lettuce and blue green algae [
17]. Aquaria were cleaned weekly for removal of feces and dead snails [
18]. Laboratory-reared
Biomphalaria alexandrina reaching 6-7 mm in shell diameter was exposed to
S. mansoni miracidial infection according to a previous study [
18]. Harvesting the snails was done as follows: 50 snails at 2 weeks after infection (G1), 50 snails at the time of patency development (G2), and 50 snails at 2 weeks after patency (G3). Uninfected cohort snails of the same shell diameter were maintained in the same manner and harvested at corresponding intervals.
The hemolymph samples were collected from each snail after cleaned with a paper towel by a pasteur pipette inserted through a tiny hole made in the pericardial region then centrifuged at 120
g for 5 min to separate the supernatant from hemocytes and cell debris, then the supernatant was kept at -20℃ till the time of extraction [
19].
The DGG tissue extract samples were prepared by its dissection free from the snail body then carboxylic acid extraction was done using 50% Ringer's solution (Carolina Biological Supply, North Carolina, USA). Centrifugation of the extract was done at 250
g for 15 min to collect the supernatants which were stored at -20℃ until use [
16].
Synthetic standards of acetic, fumaric, oxalic, malic, and pyruvic acids (Sigma-Aldrich, St. Louis, Missouri, USA) in the highest purity grade available were determined by C18 ion-suppression reversed-phase HPLC according to the procedure previously reported [
20]. Using adjusted HPLC graded water as the mobile phase, isocratic elution was done at a flow rate of 1 ml/min, and the ultraviolet diode array detector at 210 nm with a sensitivity of 0.02 absorbance units was used to obtain chromatograms of the carboxylic acid standards studied in order to determine the retention time of each acid. Then, calibration curves of each standard separately were done by plotting the peak area of each standard against its concentration then pooling of studied carboxylic acid standards was done to obtain calibration curves of the studied acids mixture.
Identification of carboxylic acids in studied samples was made by matching the peak area retention times between standards and studied samples chromatograms. Validation was made by comparing the standards and samples ultra violet spectra collected by the detector during the separation. Quantitative analyses of the identified acids were done by generating graphs that relates the standard concentrations of the acids to their peak areas. Results were achieved by intrapolation within the calibration curve.
Pooling of each 10 snails was used throughout the study and the mean of 10 trails for each HPLC analysis was done for each sample. The conversions to part per million concentrations (ppm) were done according to the previous report [
20].The concentration (ppm) of each acid in snail DGGs was calculated by multiplication of the sample solution concentration interpolated from calibration curve (I, ppm) by the original sample volume (V, ml), and division of the product by the mass of the snail DGG (M, g) and for hemolymph, carboxylic acid concentration (µg/dl) was calculated by multiplying I times V times 100, and division of the product by the hemolymph volume (HV, ml) according to the method of a previous report [
19].
RESULTS
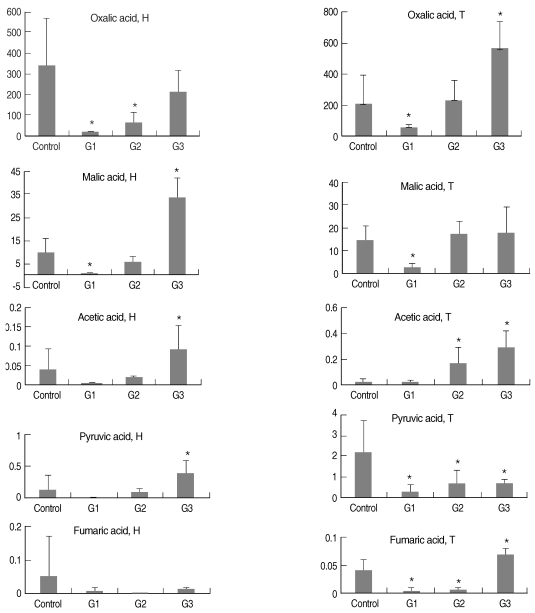
The carboxylic acids, including acetic, fumaric, oxalic, malic, and pyruvic acids, were separated and quantified in both the hemolymph (H) and DGG samples (T) of
B. alexandrina snails (
Fig. 1;
Tables 1-
4). Each acid in the hemolymph and DGG samples revealed the results of statistical comparisons as shown in
Fig. 1 and
Tables 1-
4. The Z-scores were high in malic acid in both hemolymph and tissue samples (G1), in oxalic acid in hemolymph and acetic acid in tissue samples (G2), and in malic acid in hemolymph samples and the acetic acid in tissue samples (G3).
DISCUSSION
The major physiological and metabolic mechanisms of snail-schistosome relationships that are crucial for survival, growth, and efficient transmission of parasites remain partially known [
21]. In our study, separation and quantitative determination of the 5 carboxylic acids were done by the ion-suppression reversed-phase HPLC which has 2 significant features; the use of extremely diluted perchloric acid in water as the mobile phase decreases the total analysis time and provides good separation of the samples that facilitates simultaneous determination of all the acids of interest.
The separation technique was successfully adapted to be used on hemolymph and tissue samples. Also on applying the used technique on the acetic and pyruvic acids, which was not tested previously [
20], separation was achieved successfully, and it was possible to separate and quantify the 5 acids at the same time in 1 sample of hemolymph and in 1 sample of tissue extract with lesser retention time than those in other papers [
19,
22,
23]. Without need for solid phase extraction before HPLC analysis, the used technique was a convenient, easier, faster, more accurate, and economical method of carboxylic acid separation. It is also recommended to test this technique for separating other carbohydrate intermediary metabolites not indexed in this study.
The order of concentration of the carboxylic acids in the hemolymph of both control and G1 snails was oxalic > malic > pyruvic > fumaric > acetic, and was oxalic > malic > pyruvic > acetic > fumaric in both G2 and G3. This order is different from that found in a previous study [
23] in the hemolymph of the albino strain of
B. glabrata and from another study [
19] in the hemolymph samples of
B. glabrata. Also the order of concentration of the carboxylic acids in DGG was different from those in the above studies [
19,
23], as the order was oxalic > malic > pyruvic > fumaric > acetic for control snails hemolymph and oxalic > malic > pyruvic > fumaric > acetic for G1, G2, and G3 tissue samples. Differences in concentrations of these acids in the snails probably reflect differences between the
B. alexandrina and
B. glabrata species used. These biochemical differences between the African and South American pulmonate anails are not surprising when it is considered that they have been geographically separated since the Jurassic or Cretaceous period.
Regarding the change in the acid concentrations during the studied course of infection, the following was reported. Reduction in the acid concentrations from that of the controls in G1 and G2 is explained by their possible use as metabolites by the developing schistosome sporocysts and cercariae [
24]. These larval stages inhabit the intertubular spaces of the DGG and cause mechanical and lytic damage to the digestive gland cells of the hepatopancreas [
24]. The damage probably results in a leakage of the acids, which are in turn utilized by the larval schistosomes. Moreover, increased metabolic activity associated with the presence of larval trematodes may accelerate the use of the acids by host cells in the digestive gland as well [
24], the site of active intermediary metabolism in these snails is associated with the mitochondria of the digestive gland cells [
19].
Along the studied course of infection, the increase of acid concentrations in between the stages of infection in both hemolymph and tissues might be explained by that the course of infection in snails is well regulated. The rhythmic nature of parasite development and cercarial release strongly suggests that the host undergoes a cyclic pattern of metabolic exhaustion followed by a period of recovery, thereby ensuring optimal and long-term utilization of host resources for parasite success. The success of both the parasite's penetration of the snail's skin [
25,
26] and the establishment of an infection [
27] are generally correlated with the hemolymph composition [
5]. The changes of metabolite levels may be due to drastically different causes; activities of membrane transport proteins may have been altered, and rates of metabolic reactions may have shifted, or branch point enzyme activities might have changed. Even if metabolite levels are found unchanged between different experimental situations, the underlying flux differences and enzymatic activities might still have changed [
28].
Infection rates in field populations of snails are routinely determined by cercarial shedding neglecting prepatent snail infections, which can constitute a significant proportion of infected snails because of lack of a suitable method for diagnosis. Several studies were done to find methods for diagnosis of prepatant infection, such as monoclonal antibodies and PCR techniques [
29]. The trial to test the carboxylic acids as a potential diagnostic biomarker was one of the aims of this study. HPLC analysis, which is less expensive and more rapid than the previously mentioned techniques, succeeded in stating that these acids could be used as diagnostic biomarkers to detect whether the snail is infected or not and what is the stage of infection. In addition, all of the studied acids in both the hemolymph and tissue samples could be used as a potential diagnostic biomarker except for the fumaric acid in hemolymph.
The most sensitive acid that could discriminate the 4 groups from each other was malic acid in hemolymph samples as it showed the highest F-ratio. Therefore, further assessment is recommended on their validity for usage on field studies to diagnose schistosomal infection of B. alexandrina snails and to state the stage of infection, and assessment of these acids in earlier prepatency diagnosis is required to be investigated.
The key challenges in the antiparasitic drug discovery are target selection and identification of appropriate small molecules as potential ligands for these targets. The search for biomarkers that might be useful in the drug discovery and development is an active area of research, and the complexity of disease and drug effects means that biomarker combinations will be more accurate [
28].
In conclusion, consistent differences in both the hemolymph and tissue carbohydrate metabolites profiles of B. alexandrina infected with S. mansoni and size-matched uninfected control snails were identified with a HPLC strategy which allowed the prediction of infected and uninfected snails and possibly determination of the stage of infection. These findings highlight the potential of metabolomics as a novel approach for fundamental investigations of host-pathogen interactions as well as disease surveillance and control.
References
- 1. Ross AG, Sleigh AC, Li YS, Williams GM, Aligui GDL, McManus DP. Is there immunity to Schistosoma japonicum? Parasitol Today 2000;16:159-164.
- 2. Negrao-Corrêa D, Pereira CAJ, Rosa FM, Martins-Souza RL, Andrade ZA, Coelho PMZ. Molluscan response to parasite, Biomphalaria and Schistosoma mansoni interaction. Inverteb Surv J 2007;4:101-111.
- 3. Lotfy WM, Dejong RJ, Abdel-Kader A, Loker ES. A molecular survey of Biomphalaria in Egypt: Is B. glabrata present? Am J Trop Med Hyg 2005;73:131-139.
- 4. Kaddurah-Daouk R, Kristal B, Bogdanov M, Matson W, Beal F. In Vaidyanathan S, Harrigan G, Goodacre R, editors. Metabolomics: a new approach towards identifying biomarkers and therapeutic targets in CNS disorder. Metabolome Analyses: Strategies for Systems Biology. 2005. New York, USA. Springer; p. 45-62.
- 5. Becher W. Metabolic interrelationship of parasitic trematodes and molluscs, especially Schistosoma mansoni in Biomphalaria glabrata. Z Parasitenkd 1980;63:101-111.
- 6. Mohamed AM, Ishak MM. Comparative effects of schistosome infection and starvation on the respiratory transport chain of the snails Biomphalaria alexandrina and Bulinus trancatus. Comp Biochem Physiol (B) 1982;71:289-292.
- 7. Thompson SN, Lee RKW. Comparison of starvation and infection by Schistosoma mansoni on tissue viability and the 13p NMR spectrum of Biomphalaria glabrata. Z Parasitenkd 1986;72:417-421.
- 8. Hulka BS. Epidemiological studies using biological markers: issues for epidemiologists. Cancer Epidemiol Biomarkers Prev 1991;1:13-19.
- 9. Mayeux R. Epidemiology of neurodegeneration. Annu Rev Neurosci 2003;26:81-104.
- 10. Vaidyanathan S, Jones D, Broadhurst DI, Ellis J, Jenkins T, Dunn WB, Hayes A, Burton N, Oliver SG, Kell DB, Goodacre R. A laser desorption ionisation mass spectrometry approach for high throughput metabolomics. Metabolomics 2005;1:243-250.
- 11. Wang Y, Holmes E, Nicholson JK, Cloarec O, Chollet J, Tanner M, Singer BH, Utzinger J. Metabonomic investigations in mice infected with Schistosoma mansoni: an approach for biomarker identification. PNAS 2004;101:12676-12681.
- 12. Lamers RJ, van Nesselrooij JHJ, Kraus VB, Jordan JM, Renner JB, Dragomir AD, Luta G, van der Greef J, DeGroot J. Identification of an urinary profile associated with osteoarthritis. Osteoarthritis Cartilage 2005;13:762-768.
- 13. Ishak MM, Mohamed AH, Sharaf AA. Carbohydrate metabolism in uninfected and trematoda infected snails Biomphalaria glabrata and Bulinus trancatus. Comp Biochem Physiol (B) 1975;51:499-505.
- 14. Patience RL, Thomas JD, Sterry PR. Production and release of carboxylic acids during oxic and anoxic metabolism by the pulmonate snail Biomphalaria glabrata. Comp Biochem Physiol 1983;76(B):253-262.
- 15. Hardewig I, Pfirtner HO, Grieshaber MK. Interactions of anaerobic propionate formation and acid base status in Arenicola marina: an analysis of propionyl-CoA carboxylase. Physiol Zool 1994;67:892.
- 16. Massa DR, Chejlava MJ, Sherma J. Thin layer and high performance column liquid chromatographic analysis of selected carboxylic acids in standards and from Heliosoma trivolvis snails. J Liq Chromatogr Relat Technol 2007;30:2221-2229.
- 17. Becker W, Lamprecht I. Mikrokalorimetrische Untersuchungen zum Wirt-Parasit-Verhaltnis zwischen Biomphalaria glabrata und Schistosoma mansoni. Z Parasitenkd 1977;53:297-305.
- 18. Schneck JL, Fried B. Growth of Biomphalaria glabrata (NMRI strain) and Heliosoma trivolvis (Colorado strain) under laboratory conditions. Am Malacol Bull 2005;20:71-73.
- 19. Massa R, Chejlava J, Fried B, Sherma J. High performance column liquid chromatographic analysis of selected carboxylic acids in Biomphalaria glabrata patently infected with Schistosoma mansoni. Parasitol Res 2007;101:925-928.
- 20. Lian HZ, Mao L, Ye XL, Miao J. Simultaneous determination of oxalic, fumaric, maleic and succinic acids in tartaric and malic acids for pharmaceutical use by ion-suppression reversed-phase high performance liquid chromatography. J Pharm Biomed Anal 1999;19:621-625.
- 21. Khayath N, Vicogne J, Ahier A, BenYounes A, Konrad C, Trolet J, Viscogliosi E, Brehm K, Dissous C. Diversification of the insulin receptor family in the helminth parasite Schistosoma mansoni. FEBS J 2006;274:659-676.
- 22. Bezerra JCB, Becker W, Zelck UE. A comparative study of the organic acid content of the hemolymph of Schistosoma mansoni-resistant and susceptible strains of Biomphalaria glabrata. Mem Inst Oswaldo Cruz 1997;92:421-425.
- 23. Bezerra JCB, Kemper A, Becker W. Profile of organic acid concentrations in the digestive gland and hemolymph of Biomphalaria glabrata under estivation. Mem Inst Oswaldo Cruz 1999;94:779-784.
- 24. Thompson SN. In Fried B, Graczyk TK, editors. Physiology and biochemistry of snail-larval trematode relationships. Advances in Trematode Biology. 1997. Florida, USA. CRC Press; p. 149-195.
- 25. Loker ES, Bayne CJ. In vitro encounters between Schistosoma mansoni primary sporocysts and hemolymph components of susceptible and resistant strains of Biomphalaria glabrata. Am J Trop Med Hyg 1982;31:999-1005.
- 26. Bayne CJ, Loker ES. In Rollinson D, Simpson AJG, editors. Survival within the snail host. The Biology of Schistosomes. 1987. London, UK. Academic Press; p. 321-346.
- 27. Frandsen F. Discussion of the relationships between Schistosoma and their intermediate hosts, assessment of the degree of host-parasite compatibility and evaluation of schistosome taxonomy. Z Parasitenkd 1979;58:275-296.
- 28. Lindon JC, Nicholson JK, Holmes E. Metabonomics and metabolomics techniques and their applications in mammalian systems. Handbook of Metabonomics and Metabolomics. 2007. Elsevier; p. 1-35.
- 29. Hamburger J, He-Na Xin XY, Ramzy RM, Jourdane J, Ruppel A. A polymerase chain reaction assay for detecting snails infected with bilharzia parasites (Schistosoma mansoni) from very early prepatency. Am J Trop Med Hyg 1998;59:872-876.
Fig. 1Intergroup differences of various kinds of acid concentrations (ppm) in the hemolymph (H) and tissues (T) of Biomphalaria alexandrina snails. *Significantly different from controls.

Table 1.Z-scores of the studied acid concentrations at week 2 post-exposure in relation to the control concentrations in hemolymph (H) and tissue samples (T) of Biomphalaria snails
Table 1.
|
Mean |
Minimum |
Maximum |
|
Oxalic acid (H) |
-1.38209 |
-1.41515 |
-1.33735 |
|
Oxalic acid (T) |
-1.05023 |
-1.20331 |
-0.87253 |
|
Malic acid (H) |
-1.44444 |
-1.52463 |
-1.3168 |
|
Malic acid (T) |
-1.60305 |
-1.78053 |
-1.16057 |
|
Acetic acid (H) |
-0.75891 |
-0.78918 |
-0.70681 |
|
Acetic acid (T) |
0.171911 |
-0.56902 |
0.538298 |
|
Pyruvic acid (H) |
-0.51723 |
-0.54323 |
-0.48306 |
|
Pyruvic acid (T) |
-1.20499 |
-1.34686 |
-0.82859 |
|
Fumaric acid (H) |
-0.28897 |
-0.34896 |
-0.11288 |
|
Fumaric acid (T) |
0.296951 |
-1.91227 |
-1.20785 |
Table 2.Z-scores of the studied acid concentrations in the shedding group in relation to the control concentrations in hemolymph (H) and tissue samples (T) of Biomphalaria snails
Table 2.
|
Mean |
Minimum |
Maximum |
|
Oxalic acid (H) |
-1.19261 |
-1.37694 |
-0.8284 |
|
Oxalic acid (T) |
0.084426 |
-1.00877 |
1.117237 |
|
Malic acid (H) |
-0.65083 |
-1.17064 |
-0.30521 |
|
Malic acid (T) |
0.442156 |
-0.38032 |
1.856615 |
|
Acetic acid (H) |
-0.44183 |
-0.52201 |
-0.33172 |
|
Acetic acid (T) |
4.468984 |
0.496846 |
10.49204 |
|
Pyruvic acid (H) |
-0.1552 |
-0.46588 |
0.129541 |
|
Pyruvic acid (T) |
-0.94749 |
-1.37815 |
-0.29245 |
|
Fumaric acid (H) |
-0.34875 |
-0.34989 |
-0.34638 |
|
Fumaric acid (T) |
0.360514 |
-1.86626 |
-1.39219 |
Table 3.Z-scores of the studied acid concentrations at week 2 post-shedding in relation to the control concentrations in hemolymph (H) and tissue (T) samples of Biomphalaria snails
Table 3.
|
Mean |
Minimum |
Maximum |
|
Oxalic acid (H) |
-0.52772 |
-0.88576 |
0.224254 |
|
Oxalic acid (T) |
2.252059 |
0.723009 |
3.819674 |
|
Malic acid (H) |
3.708717 |
2.538604 |
5.96211 |
|
Malic acid (T) |
0.502933 |
-1.0303 |
2.822573 |
|
Acetic acid (H) |
0.976976 |
-0.32665 |
2.781462 |
|
Acetic acid (T) |
8.205403 |
3.394261 |
11.75678 |
|
Pyruvic acid (H) |
1.154511 |
0.194036 |
2.042517 |
|
Pyruvic acid (T) |
-0.95452 |
-1.13838 |
-0.80444 |
|
Fumaric acid (H) |
-0.24024 |
-0.29796 |
-0.19232 |
|
Fumaric acid (T) |
0.377234 |
0.689586 |
2.158821 |
Table 4.F-ratios of the studied acids in hemolymph (H) and tissue (T) samples of Biomphalaria snails
Table 4.
|
F |
Pa
|
Significance |
|
Oxalic acid (H) |
5.801 |
0.004 |
HS |
|
Oxalic acid (T) |
11.549 |
0.001 |
HS |
|
Malic acid (H) |
31.208 |
0.001 |
HS |
|
Malic acid (T) |
4.469 |
0.012 |
S |
|
Acetic acid (H) |
3.696 |
0.024 |
S |
|
Acetic acid (T) |
18.118 |
0.001 |
HS |
|
Pyruvic acid (H) |
4.025 |
0.018 |
S |
|
Pyruvic acid (T) |
4.793 |
0.009 |
HS |
|
Fumaric acid (H) |
0.415 |
0.744 |
NS |
|
Fumaric acid (T) |
18.71 |
0.001 |
HS |