Abstract
To assess the relationship between the changes of cellular components and the production of Th1 cytokine in the immune tissue, inbred C57BL/6 mice were orally infected with 40 cysts of 76K strain of Toxoplasma gondii. The sequential change of cell differentials and IFN-γ production of splenocytes were analyzed by Diff-Quik stain and RT-PCR. There were no significant proportional changes of cellular components of splenocytes until day 4 postinfection (PI) as compared to those of day 0, and the relative percentage of macrophages and neutrophils/eosinophils increased significantly (p<0.01) thereafter. The expression of IFN-γ mRNA of CD3- cells was observed from day 1 PI at a low level. However, IFN-γ production of CD3+ cells increased significantly from day 4 PI (p<0.01) which progressively increased thereafter. These findings provide the relative percentages of granulocytes and macrophages were increased in conjunction with increase of total number of splenocytes after oral infection with T. gondii in the susceptible murine hosts, and lymphocytes were the major cellular components and the important source of IFN-γ.
-
Key words: Toxoplasma gondii, toxoplasmosis, splenocytes, cell differentials, IFN-γ, granulocytes
INTRODUCTION
Toxoplasma gondii is an obligate intracellular protozoan parasite, and it has a wide range of intermediate hosts including humans (
Kasper, 1997). The course of infection is highly variable and the outcome depends on numerous host factors including the species, genetic background, and immunologic status of hosts, but it also depends on the route of infection, the parasite strain, and the infecting parasite stages (
Johnson, 1984;
McLeod et al., 1989). In healthy hosts, the course of toxoplasmosis is benign without any symptoms. However, it can cause life-threatening disease in immunocompromised hosts such as AIDS patients and transplant recipients (
Kasper, 1997).
The control of acute
T. gondii infection depends on a strong cell-mediated immune response, and the parasite is a potent stimulus of this type of immunity (
Gazzinelli et al., 1991). IFN-γ is considered to be the central protection against intracellular parasite infections, and has been known to play a major role in resistance to
T. gondii infection in mice (
Suzuki et al., 1988;
Gazzinelli et al., 1991). Neutralization of IFN-γ either leads to the death of mice infected with an avirulent strain of
T. gondii or induces reactivation of the disease in chronically infected mice due to cyst rupture (
Suzuki et al., 1990). On the contrary, IFN-γ mediates necrosis of the small intestine of mice with genetic susceptibility to peroral infection with
T. gondii (
Liesenfeld et al., 1996).
The spleen is a well-organized secondary lymphoid organ and possesses many different types of cells including lymphocytes, macrophages, and granulocytes. There have been many reports on the analysis of the T lymphocyte subpopulation after immunization or infection with
T. gondii (
Gazzinelli et al., 1991); however, little information is available with respect to the proportional changes of the cellular components of immune-related tissues in conjunction with the production of Th1 cytokine after oral infection with bradyzoites, which is the natural mode of transmission of
T. gondii. In this study, we have assessed the relationship between the changes of cell differentials and IFN-γ production of spleen in the susceptible murine hosts after oral infection of
T. gondii.
MATERIALS AND METHODS
Toxoplasma strain and oral infection of mice
The 76K strain of
T. gondii described by Laugier and Quilici (
1970) was maintained and used in the experiments in C57BL/6 mice following oral administration of five cysts.
The brain tissue containing cysts of T. gondii 76K strain was homogenized in saline, and the number of cysts was determined by counting six different samples at a voulme of 10 µl each. Forty cysts were administered orally to the female inbred C57BL/6 mice (Jackson Laboratories, Bar Harbor, USA). The day of infection was referred to as Day 0, and the survival rate was recorded daily until all mice were dead. At various time intervals, five mice were killed for the determination of cellular components and IFN-γ production in the spleen. The brains from uninfected mice were removed in parallel, and an equal volume was orally administered as a control.
Preparation of splenocytes
Five mice each from the infected and uninfected control groups were sacrificed after oral infection. The splenocytes were collected and washed with RPMI 1640 (Sigma) containing 10% heat-inactivated fetal calf serum (Hyclone Laboratories, Logan, USA), 1 mM sodium pyruvate (Sigma), 2 mM L-glutamine (Sigma), 5 nM 2-mercaptoethanol, 100 units/ml penicillin and 100 µg/ml streptomycin (Sigma). Erythrocytes were lysed by lysis buffer (Sigma). The cells were washed and then resuspended in RPMI 1640.
Cell differentials of splenocytes
For the differential counts of cellular components of splenocytes, cell suspensions were cytocentrifuged onto glass slides at 700 rpm for 5 min, and air dried. After methanol fixation, the splenocytes were stained with Diff-Quik (Baxter Scientific Products, McGraw Park, USA). The compositions of splenocytes were divided into three groups, that is, lymphocytes, macrophages and neutrophils/eosionophils and the percentages of each cellular component was calculated. Cyto-spinned preparations were examined at × 200~400 magnification in a Zeiss Axiophot microscope.
Purification of CD3- and CD3+ cells by magnetic cell sorting (MACS)
CD3- and CD3+ cells from splenocytes were separated according to the instruction of manufacturer (Miltenyi Biotech Inc., Auburn, USA). Splenocytes were washed two times with 0.1% BSA/PBS, and then incubated with FITC-conjugated anti-mouse CD3 mAb (PharMingen, San Diego, USA) for 1 hr at 4℃. The concentration of mAb used was 0.25 µl (0.5 mg/ml) per 106 cells. After washing, pellets were resuspended with 270 µl of 0.1% BSA/PBS containing 2 mM EDTA and 30 µl of anti-FITC MicroBeads, and then incubated for 45 min at 4℃. After two more washing, cells were applied into MiniMacs column (Miltenyi Biotech Inc.). CD3- cells were separated first followed by a collection of CD3+ cells by removing the magnetic field.
Each fraction was confirmed by flow cytometry. Briefly, splenocytes containing 1×10⁶ cells were incubated with either 50 µl of biotinylated anti-mouse CD3 mAb or biotinylated isotype-specific control (PharMingen) for 60 min at 4℃. Then, the cells were washed and incubated with 50 µl of streptavidin conjugated-FITC for 45 min at 4℃. After washing, the cells were fixed with 1% paraformaldehyde, and then they were analyzed by flow cytometry (FACScan; Becton Dickinson, Mountain View, USA).
IFN-γ mRNA level of splenocytes by RT-PCR
Purified splenic CD3
- and CD3
+ cells from infected and uninfected control mice were resuspended in Trizol (Life Technologies, Bethesda, USA) and were frozen at -70℃. Total RNA of CD3
- and CD3
+ cells were extracted according to the directions provided by the manufacturer (Life Technologies). Reverse transcription (RT) was done using murine Moloney leukemia virus reverse transcriptase (Life Technologies), RT random hexamer primers (Promega, Madison, USA) and Taq DNA polymerase. For PCR, a multiple cytokine-containing competitive construct PQRS was used as an internal standard (
Reiner et al., 1993). Aliquots of cDNA were assayed for hypoxanthine guanine phosphoribosyltransferase (HPRT) and IFN-γ by examining the ratio of competitor to wild-type band intensity following amplification by each primer set. The sequence of HPRT and IFN-γ specific primer pairs were as follows: HPRT, 3'-GAGGGTAGGCTGGCCTATGGCT-5'and 5'-GTTGGATACAGGCC-AGACTTTGTTG-3'; IFN-γ, 3'-CTCATGGAATGCATCCTTTTTCG-5'and 5'-CATTGAAAGCCTAGAAAGTCTG-3'. After repeated cyclings, the PCR products were separated by electrophoresis on 3% agarose gels in order to discriminate the larger competitor constructs from the unknown which are the wild-type cDNAs that migrate at a faster rate in the gel.
ANOVA of SYSTAT 5.2.1. software (SPSS Inc., Chicago, USA) was used for analyzing data from these experiments. Differences between the means were considered significant when p values were lower than 0.05.
RESULTS
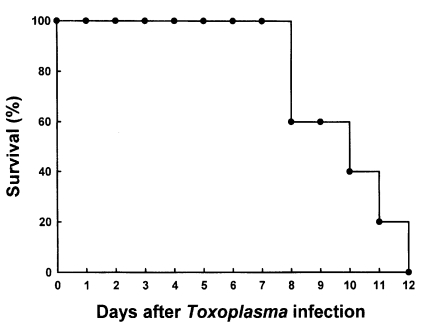
C57BL/6 mice died between 8 and 12 days after oral infection with 40 brain cysts of 76K strain of
T. gondii (n=5, repeated two times). The mean survival rate was 9.8 days (
Fig. 1). As shown in
Table 1, the total number of splenocytes from infected mice began to increase from day 1 PI and the number significantly increased from day 4 PI than those of uninfected mice (p<0.01). On day 10 PI, the number of splenocytes were about three times higher than those of uninfected control.
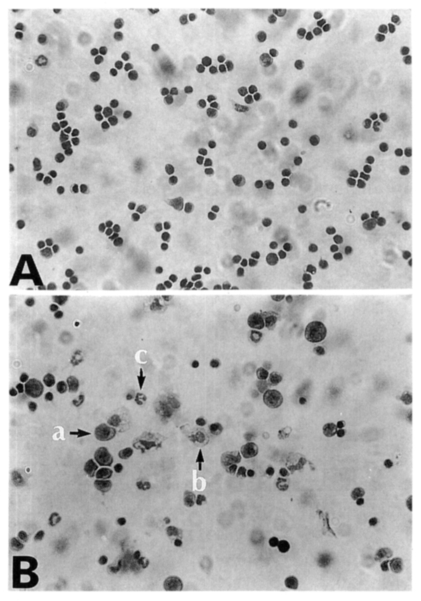
About 97% of splenocytes were lymphocytes before infection. The relative percentages of lymphocytes, macrophages and neutrophils/eosinophils among the splenocyte population during the infection period are described in
Table 2. There were no significant changes of cellular components until day 4 PI. At day 7 and 10 PI, the relative percentages of macrophages and neutrophils/eosinophils significantly increased than those of uninfected mice (
Table 2,
Fig. 2).
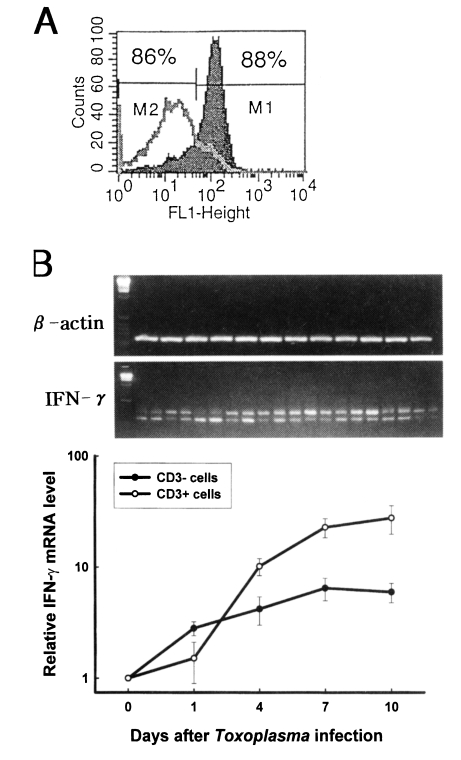
The purity of CD3
- and CD3
+ cells were 88±3% and 89±2%, respectively (
Fig. 3A). Quantitative competitive (QC) PCR was performed to determine the expression of IFN-γ mRNA in the fractionated splenocytes after
T. gondii infection. As shown in
Fig 3B, the relative IFN-γ mRNA expression of CD3
- cells significantly increased from the beginning of infection compared with that of uninfected mice (p<0.01), whereas the level of mRNA of CD3
+ cells significantly increased from day 4 PI (p<0.01). The relative IFN-γ mRNA level of CD3
+ cells was higher when compared to that of CD3
- cells from day 4 PI.
DISCUSSION
The patterns of acute toxoplasmosis vary according to the different strains of mice and parasites as well as the route of infection. In the present study, C57BL/6 mice were found to be very susceptible to
T. gondii after oral infection. Susceptibility to
T. gondii could have been caused by another adventitious pathogen, ineffective or incomplete immune responses to
T. gondii, or tissue destruction by intense immune response (
McLeod et al., 1989); however, the major cause of death has not yet been well-defined.
There are marked variations of periods in the early survival of inbred strains of mice after infection with
T. gondii. The present study showed that all female C57BL/6 mice died within 12 days following oral infection with 40 cysts of 76K strain of
T. gondii, which is consistent with those reported by Buzoni-Gatel et al. (
1997). However, Chardes et al. (
1993) reported that spleen cells were harvested once per week until day 91 after infection with same 76K strain of
T. gondii. There were prominent differences of survival days after infection between two reports. That is why sexual difference revealed a dramatic difference in the susceptibility. This study used female mice which are more susceptible to acute
Toxoplasma infection due to a different genetic background, major histocompatibility complex haplotype and cytokine production between two sexes (
Johnson, 1984;
McLeod et al., 1989;
Roberts et al., 1995).
Immunity in mice infected with
Toxoplasma is dependent on the ability to generate protective level of IFN-γ (
Suzuki et al., 1988;
Gazzinelli et al., 1991;
Khan et al., 1994). Many cell types have been known to produce IFN-γ, including CD4
+ and CD8
+ T cells, NK cells and cells carrying IL-2R that do not fit the criteria for either T cell, B cell, or monocyte lineages (
Gazzinelli et al., 1991;
Denkers and Sher, 1997). In lymphocyte depletion and transfer experiments, most of active IFN-γ in vivo are produced by CD8
+ cells, and the protective capability of these cells may also be due to their cytolytic activity (
Khan et al., 1994). On the other hand, acute
T. gondii infections may stimulate uncontrolled IFN-γ synthesis, and this hyperactive immune response can be detrimental to the host (
Gazzinelli et al., 1996). In the present study, CD3- cells significantly produced the IFN-γ from day 1 PI, thereafter CD3
+ cells were the dominant subsets expressing IFN-γ. This means that none of the T-cells, including macrophages and NK cells, are the central source of IFN-γ in the early
T. gondii infection while the level of cytokine is derived from
T. gondii-activated T cells at later time (
Gazzinelli et al., 1991;
Denkers and Sher, 1997).
The spleen contains a large number of erythrocytes, macrophages, lymphocytes, plasma cells and granulocytes. In this study, a total number of splenocytes increased after
Toxoplasma infection, and more than 95% of the population were lymphocytes until day 4 PI. Thereafter, the relative percentages of neutrophils/eosinophils significantly increased. Similar findings were also reported that the large variations in the white blood cell counts occurred during the first 3 weeks of infection mainly due to increased numbers of eosinophils and neutrophils (
Sumyuen et al., 1995). However, the function of granulocytes is not well-understood in toxoplasmosis. Neutrophils are responsible for the dissemination of
T. gondii tachyzoites in the absence of specific antibodies (
Chai et al., 1997), and they play an important role showing resistance against acute primary
T. gondii infection (
Sayles and Johnson, 1996-97).
From this study, we suggested that initial source of Th1 cytokine to T. gondii infection is dependent on the innate immune response associated with the interaction of macrophages and NK cells, thereafter T cells constitute the adaptive immune respone in the murine host.
References
- 1. Buzoni-Gatel D, Lepage AC, Dimier-Poisson IH, Bout DT, Kasper LH. Adoptive transfer of gut intraepithelial lymphocytes protects against murine infection with Toxoplasma gondii. J Immunol 1997;158:5883-5889.
- 2. Chai JY, Kook J, Guk SM, Chang YP, Yun CK. Experimental infection of murine splenic lymphocytes and granulocytes with Toxoplasma gondii RH tachyzoites. Korean J Parasitol 1997;35:79-85.
- 3. Chardes T, Velge-Roussel F, Mevelec P, Mevelec M-N, Bozoni-Gatel D, Bout D. Mucosal and systemic cellular immune responses induced by Toxoplama gondii antigens in cyst orally infected mice. Immunology 1993;78:421-429.
- 4. Denkers EY, Sher A. Role of natural killer and NK1+ T-cells in regulating cell-mediated immunity during Toxoplasma gondii infection. Biochem Soc Trans 1997;25:699-703.
- 5. Gazzinelli RT, Hakim FT, Hieny S, Shearer GM, Sher A. Synergistic role of CD4+ and CD8+ T lymphocytes in IFN-γ production and protective immunity induced by an attenuated Toxoplasma gondii vaccine. J Immunol 1991;146:286-293.
- 6. Gazzinelli RT, Wysocka M, Hieny S, et al. In the absence of endogenous IL-10, mice acutely infected with Toxoplasma gondii succumb to a lethal immune response dependent on CD4+ cells and accompanied by overproduction of IL-12, IFN-γ, and TNF-α. J Immunol 1996;157:798-805.
- 7. Johnson AM. Strain-dependent, route of challenge-dependent, murine susceptibility to toxoplasmosis. Z Parasitenkd 1984;70:303-309.
- 8. Kasper LH. Toxoplasma infection. Harrison's principles of internal medicine. 1997. 14th ed. New York, USA. McGraw-Hill; p. 1197-1202 .
- 9. Khan IA, Ely KH, Kasper LH. An antigen specific CD8+ cell clone protects against acute Toxoplasma gondii infection. J Immunol 1994;152:1856-1860.
- 10. Lauier M, Quilici M. Experimental value of Toxoplasma strain only slightly pathogenic for mice. Ann Parasitol Hum Comp 1970;45:389-403.
- 11. Liensenfeld O, Kosek J, Remington JS, Suzuki Y. Association of CD4+ T cell-dependent, interferon-γ-mediated necrosis of the small intestine with genetic susceptibility of mice to peroral infection with Toxoplasma gondii. J Exp Med 1996;184:597-607.
- 12. McLeod R, Eisenhauer P, Mack D, Brown C, Filice G, Spitalny G. Immune responses associated with early survival after peroral infection with Toxoplasma gondii. J Immunol 1989;142:3247-3255.
- 13. Reiner SL, Zheng S, Corry DB, Locksley RM. Constructing polycompetitor cDNAs for quantitative PCR. J Immunol Methods 1993;165:37-46.
- 14. Roberts CW, Cruickshank SM, Alexander J. Sex-determined resistance to Toxoplasma gondii is associated with temporal differences in cytokine production. Infect Immun 1995;63:2549-2555.
- 15. Sayles PC, Johnson LL. Exacerbation of toxoplasmosis in neutrophil-depleted mice. Nat Immun 1996-1997;15:249-258.
- 16. Sumyuen MH, Garin YJF, Derouin F. Early kinetics of Toxoplasma gondii infection in mice infected with orally with cysts of an avirulent strain. J Parasitol 1995;81:327-329.
- 17. Suzuki Y, Conley FK, Remington JS. Treatment of toxoplasmic encephalitis in mice with recombinant gamma interferon. Infect Immun 1990;58:3050-3055.
- 18. Suzuki Y, Orellana MA, Schreiber RD, Remington JS. Interferon-γ : the major mediator of resistance against Toxoplasma gondii. Science 1988;240:516-518.
Fig. 1Survival rate of C57BL/6 mice after oral infection with 40 cysts of 76K strain of Toxoplasma gondii. The mice (n=5) were observed daily until all mice died. The data are representative of one of two experiments.

Fig. 2Diff-Quik stained splenocytes from C57BL/6 mice at day 0 (A) and day 7 (B) postinfection. Splenocytes were cytocentrifuged onto glass slides, fixed with methanol, and then stained with Diff-Quik. a, lymphocyte; b, macrophage; c, neutrophils/eosinophils.

Fig. 3The kinetics of IFN-γ mRNA expression of CD3- and CD3+ cells after Toxoplasma gondii infection. A. Flow cytometric profile of CD3- and CD3+ cells. Splenocytes were stained first with biotinylated anti-mouse CD3 mAb, followed by streptavidin-FITC, and then analyzed by FACScan. M1, CD3+ cells; M2, CD3- cells. B. Relative IFN-γ mRNA experssion level of splenic CD3- and CD3+ cells. The mRNA expression for IFN-γ was assayed using RT-PCR. The differences in the transcriptional level for all the genes were expressed relative to the uninfected mice (assigned as 1).

Table 1.Total number of isolated splenocytes from mice orally infected with 76K strain of
Toxoplasma gondiia)
Table 1.
|
Day after infection |
No. of splenocytes per mouseb)
|
Significancesc)
|
|
0 |
56 ± 13 × 106
|
|
|
1 |
80 ± 16 × 106
|
p>0.05 |
|
4 |
111 ± 22 × 106
|
p<0.01 |
|
7 |
103 ± 25 × 106
|
p<0.01 |
|
10 |
182 ± 18 × 106
|
p<0.01 |
Table 2.Cell differentials of splenocytes from mice orally infected with
Toxoplasma gondiia)
Table 2.
|
Day |
Lymphocytes (%) |
Macrophages (%) |
Neutrophils/eosinophils(%) |
|
0 |
97.1 ± 1.2 |
1.5 ± 0.3 |
1.4 ± 0.3 |
|
1 |
96.4 ± 0.7 |
1.9 ± 0.8 |
1.7 ± 1.0 |
|
4 |
96.0 ± 2.0 |
1.3 ± 0.3 |
2.7 ± 2.0 |
|
7 |
87.2 ± 4.0b)
|
8.3 ± 1.7b)
|
4.5 ± 1.2b)
|
|
10 |
77.5 ± 8.0b)
|
13.0 ± 5.0b)
|
9.5 ± 3.8b)
|