Abstract
Synchronized cultures are critical for studying Plasmodium falciparum intraerythrocytic development. This study aimed to quantitatively evaluate 4 common synchronization methods for the culture of P. falciparum 3D7, using a novel nanomaterial-based tool to objectively assess late-stage enrichment. The 4 methods including 5% D-sorbitol, isosmotic Percoll-Sorbitol (60% PS), discontinuous Percoll-Sorbitol gradients (70%–40% PS), and the Plasmion method. Synchronization efficiency was assessed through microscopic examination and flow cytometry. Besides SYBR Green I staining for flow cytometry, we used 20 nm polystyrene fluorescent microspheres (PFMs20) that bind parasites via new permeability pathways to validate mature-stage enrichment. The binding rate was defined as the ratio of PFMs20 positivity to SYBR Green I positivity. Microscopic examination of Giemsa-stained blood smears served as the gold standard for assessing the stage-specific profiles achieved by each synchronization method. The 4 methods yielded distinct efficiency profiles: 5% D-sorbitol achieved 88.37% ring-stage purity; 60% PS demonstrated high late-stage enrichment with PFMs20 binding rates reaching 87.47%; 70%–40% PS uniquely enabled visible hemozoin-rich layer separation and showed 88.12% binding efficiency in its schizont-enriched fraction; while Plasmion yielded a binding rate of 73.37% in its late-stage fraction. Our results formulate a clear decision matrix for synchronization protocol selection. The sorbitol method is ideal for basic ring-stage studies, Percoll-based gradients support rigorous stage-specific investigations, and the Plasmion method is well-suited for resource-limited settings. This comparative analysis provides preliminary guidelines for synchronization method selection that require validation in diverse laboratory and field contexts.
-
Key words: Plasmodium falciparum, cell synchronization, cultured cells, flow cytometry, microspheres
Introduction
Malaria is a mosquito-borne infectious disease caused by
Plasmodium parasites, imposing economic [
1] and significant public health [
2] burden worldwide. Among the 5
Plasmodium species that infect humans,
P. falciparum and
P. vivax pose the greatest threat, with
P. falciparum being the most virulent and responsible for the majority of malaria-related deaths [
3,
4].
The asexual intraerythrocytic life cycle of
P. falciparum lasts approximately 48 h in vitro [
5], during which the parasite grows and divides within human RBCs [
6]. However, in vitro cultures of
P. falciparum are inherently asynchronous due to the lack of host immune and physiological regulation [
7]. This asynchrony complicates the study of stage-specific biological processes, including drug resistance mechanisms, RBC invasion pathways, and host-parasite interactions, all of which are critical for advancing malaria research and therapeutic development [
8].
A variety of synchronization methods have been developed. Common laboratory techniques encompass several principles: those relying on the different sedimentation speeds of the infected erythrocytes depending on the age of the parasite [
9], which represent a simple and low-cost approach yet offer limited stage resolution; selective osmotic lysis of mature parasites using sorbitol [
10], which is highly effective for ring-stage enrichment but unsuitable for collecting late-stage parasites. To better elucidate the practical performance, limitations, and applicability of these conventional synchronization strategies, we systematically evaluated 4 established protocols in this study. These included 5% D-sorbitol method, discontinuous Percoll-Sorbitol gradients (70%/40%), termed 70%–40% PS hereafter, isosmotic Percoll-Sorbitol (60% v/v), termed 60% PS hereafter, and Plasmion-based separation, across multiple metrics: synchronization precision (via flow cytometry [
11] and Giemsa staining [
12]), technical complexity, and cost-effectiveness. Beyond conventional nucleic acid staining with SYBR Green I [
13], a key methodological innovation in this work involved the application of 20 nm polystyrene fluorescent microspheres (PFMs20). This nanoscale tracking system demonstrates enhanced temporal resolution compared to conventional nucleic acid staining approaches [
14]. The comparative data could offer an evidence-based protocol selection rubric, highlighting the crucial importance of a comprehensive approach to choosing an optimal synchronization strategy.
Methods
Ethics statement
The experimental protocol was reviewed and approved by the Research Ethics Committee under approval number YXYLL-2025-98.
Parasite cultivation
P. falciparum strain 3D7 was obtained from Malaria Research and Reference Reagent Resource Center, and routinely cultured in vitro as previously described [
15]. For routine subculture,
P. falciparum 3D7 parasites were cultured in a complete medium at 2% haematocrit under 5% O
2, 5% CO
2, 90% N
2 at 37°C in an incubator, confirmed regularly using an oxygen analyzer. Cultures were protected from light exposure during all incubation steps outside the incubator to prevent photodegradation of media components. Parasites were maintained for a maximum of 8 culture passages prior to experimentation.
The complete medium consisted of 10.4 g/L RPMI 1640 (Gibco) supplemented with 20 μg/ml gentamicin (Sangon Biotech), 2 g/L NaHCO₃ (China National Pharmaceutical Group Corp.), 25 mM HEPES (Solarbio), 1% (w/v) Albumax I (Gibco), and 0.1 mM hypoxanthine (Sigma-Aldrich). The incomplete medium was identical to the complete medium but lacked the supplementation with Albumax I and hypoxanthine. Human red blood cells were washed 3 times, stored at 4°C, and used within 2 weeks [
16]. The parasitemia value of a previous culture was determined via microscopic examination prior to each subculture, the blood smears were prepared, fixed with methanol, and stained with Giemsa. For the quantification of parasitemia and stage distribution, a minimum of 10,000 erythrocytes were counted across multiple microscopic fields on Giemsa-stained thin blood smears under 1,000× oil immersion. In addition, the culture medium needs to be changed every 24 h [
17].
Polystyrene fluorescent microspheres contain green fluorescent dyes (Ex 488/Em 520). Particle sizes of 20 nm fluorescent microspheres were obtained from Jiangsu Zhichuan Technology (
Supplementary Fig. S1A). The fluorescence intensity of the specific batch used in this study was quantitatively characterized. Fluorescence intensity and linearity were measured using a Spark multimode microplate reader (Tecan). PFMs20 nanoparticles were serially diluted in 1× PBS, and 100 µl of each dilution was loaded in triplicate into a black 96-well plate. Fluorescence was measured with an excitation of 480 nm and an emission of 530 nm. The gain was set to optimal, and the signal was background-subtracted against PBS alone. A standard curve was generated to confirm the linear working range (
Supplementary Fig. S1B).
To assess the dependence of PFMs20 binding on new permeability pathways (NPPs), late‑stage P. falciparum–infected erythrocytes were incubated with the NPP inhibitor furosemide sodium. Furosemide sodium (Sangon Biotech) was dissolved in DMSO to prepare a 2 M stock solution and stored at -20°C. For inhibition assays, synchronized late trophozoite/schizont‑enriched cultures were adjusted to 2%–3% haematocrit and treated with 20 mM furosemide for 30 min at 37°C under standard culture gas conditions. Control samples received an equivalent volume of DMSO vehicle. After treatment, cells were immediately subjected to PFMs20 and SYBR Green I staining followed by flow‑cytometric analysis, as described above. Uninfected RBCs processed in parallel served as an additional negative control. The binding rate was calculated as the ratio of the positivity rate from PFMs20 immunostaining to that from SYBR Green I staining. Experiments were performed in 3 independent biological replicates.
Synchronization of parasite
Before synchronization of in vitro cultured
P. falciparum samples, the samples were stained and microscopically examined to calculate the percentage of
P. falciparum at each stage of the parasite's life, and after culturing
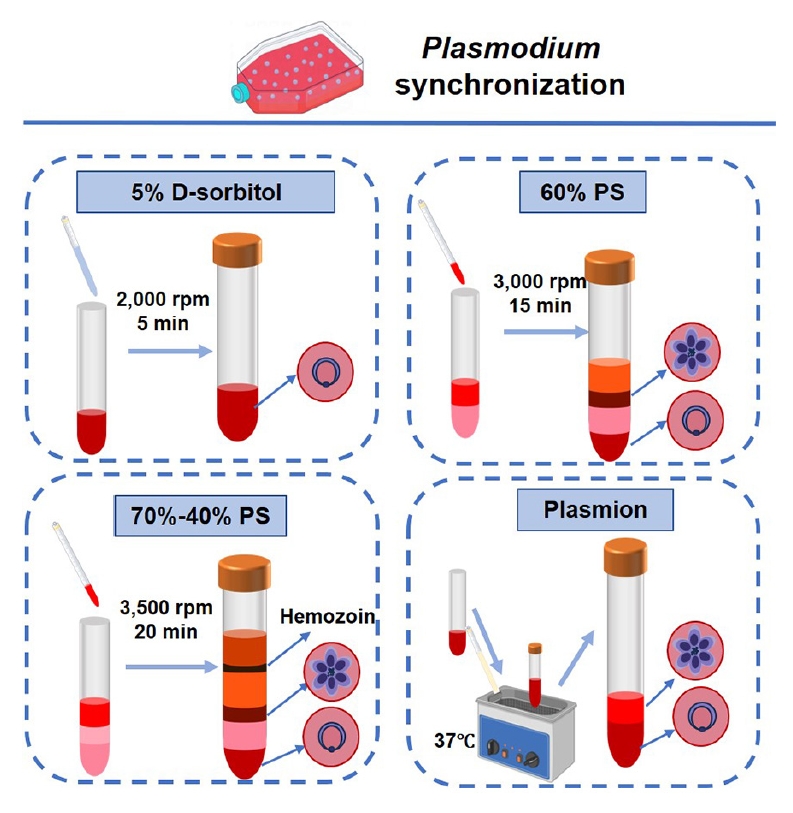
P. falciparum to a level of 5%–10% of the parasite's infectivity, the samples were divided into 4 equal parts for synchronization. One part was synchronized by treatment with 5% D-sorbitol (Sigma). Parasite cultures are treated with 5% (w/v) D-sorbitol in double distilled water for 10 min at 37°C to selectively lyse trophozoite- and schizont-infected erythrocytes. After incubation, the mixture is centrifuged (2,000 rpm, 5 min), washed twice with incomplete medium, and resuspended to obtain synchronized ring-stage parasites. Two parts of the culture used a discontinuous gradient of Percoll (GE Healthcare) with sorbitol. For 20 ml of 10× RPMI 1640, 12 g D‑sorbitol was dissolved, the volume was adjusted with distilled water, and the solution was sterilized through a 0.22 µm filter and stored at 4°C. A 90% Percoll–6% sorbitol was then prepared by mixing 20 ml 10× RPMI 1640–6% sorbitol with 180 ml Percoll. The 70% Percoll-sorbitol solution consisted of 37.5 ml of the 90% stock mixed with 10.5 ml of incomplete medium; the 40% Percoll-sorbitol solution contained 21 ml of the 90% stock and 27 ml of incomplete medium; and the 60% Percoll (isosmotic) gradient contained 13.3 ml of the 90% stock and 6.7 ml of incomplete medium. All gradients were prepared fresh or stored at 4°C for no longer than 1 week and equilibrated to 37°C immediately before use. The sample is layered onto the gradient, centrifuged (3,500 rpm, 20 min), and schizonts are collected from the 70%–40% interface. Slowly layered cell suspension on top of the freshly prepared 60% Percoll gradient and centrifuged (3,000 rpm, 15 min). Rings and uninfected RBCs at the bottom, while mature schizonts pellet remain in the upper layer, enabling schizont enrichment. One part was added an equal volume of Plasmion (100 ml of double distilled water, 0.5382 g sodium chloride, 0.0305 g magnesium chloride hexahydrate, 0.3360 g sodium lactate, 0.0373 g potassium chloride, 3 g gelatin, pH 7.2–7.4) and the solution mixed and incubated at 37°C for 30 min. After incubation, the supernatant containing the late-stage parasites (schizonts and trophozoites) were removed to a fresh tube, with the lower layer containing the pellet of uninfected red blood cells and the ring stage parasites (
Fig. 1).
Flow cytometry (NovoCyte, Agilent Technologies) analysis was carried out as described previously [
18]. SYBR Green I (Invitrogen) was selected as reference. Briefly, SYBR Green I was diluted 10,000 times with PBS; 100 µl of the diluted dye was mixed with the 2 µl packed cells, and incubated in the dark for 30 min at 37°C. The optimal incubation conditions were obtained by pre-experimentation, the PFMs20 were diluted 1:500 in PBS to achieve a final working concentration of 50 µg/ml. The washed cell pellet was resuspended in the PFMs20 solution and incubated in the dark at 37°C for 1 h. Following incubation, the cells were washed 3 times with PBS to remove unbound microspheres prior to flow cytometry analysis. The binding efficiency was then assessed by flow cytometry. Specifically, the binding rate was calculated as the ratio of the positivity rate from PFMs20 immunostaining to that from SYBR Green I staining. All the flow cytometry data acquisition and analysis were performed using a FACS Calibur. To establish the gating strategy and define background fluorescence, uninfected red blood cells were processed and analyzed in parallel with infected samples in all flow cytometry experiments. A minimum of 100,000 events in the RBC gate were acquired for each sample. The detectors for forward scatter, side scatter, and FL1 (for detection of fluorescein isothiocyanate) were set to logarithmic mode. Doublets and cell aggregates were excluded by gating on single cells using a forward scatter-height versus forward scatter-area plot prior to fluorescence analysis. Data were analyzed with FlowJo v10 (TreeStar).
GraphPad Prism version 8.4.2 (GraphPad Software) was used for statistical analyses and graphing. Data are presented as mean±SD. An unpaired two‑tailed Student t‑test was used to compare mean values between 2 groups. For comparisons among more than 2 groups, an ordinary one‑way ANOVA was performed, followed by appropriate post hoc multiple‑comparison tests when indicated; P<0.05 was considered significant.
Results
Morphological assessment of P. falciparum synchronization by different methods
Microscopic observation of the Giemsa-stained thin and thick blood smears demonstrated that
P. falciparum parasites were healthy and maintained a parasitemia level exceeding 4.50% prior to synchronization. Asynchronous cultures showed a mixed population, with 39.13% ring-stage (predominantly within 0–18 h post-invasion), 24.1% early trophozoite parasites (18–24 h), 26.12% late trophozoites (24–32 h), and 10.65% schizonts (defined as ≥3 nuclei, corresponding to 32–48 h) (
Fig. 2A;
Supplementary Fig. S2). The multi-stage malaria parasites were divided into 4 parts for each of the 4 synchronization treatments. Synchronization with 5% D-sorbitol selectively lyses late-stage and early trophozoite parasites, resulting in a highly synchronized culture enriched in early ring-stage parasites (0–18 h), with a purity of 88.37% (
Fig. 2B). In contrast, the remaining 3 methods, 60% PS, 70%–40% PS, and Plasmion-based separation, allow for the separation and collection of multiple parasite stages. The Plasmion method also allows for the collection of different parasite stages. After incubation at 37°C for 30 min, the supernatant was mainly enriched in the late trophozoites and schizonts, with schizonts (32–48 h) accounting for 55.56% of the total parasitic cells. In contrast, the pellet contained a mixed-stage parasites, including some trophozoites but predominantly ring-stage (0–18 h) parasites, which accounted for 59.30% (
Fig. 2C). The Percoll-based approaches utilize discontinuous density gradients to stratify infected erythrocytes based on parasite maturation. The 60% PS method yields 2 distinct layers after centrifugation: an upper layer enriched in late-stage infected erythrocytes with schizonts (32–48 h) accounting for approximately 67.57% and a pellet containing predominantly ring-stage (0–18 h) parasites (90.44%) (
Fig. 2D). The 70%–40% PS method separated a distinct, dark-brown hemozoin-rich layer at the interface, a feature not observed in the homogeneous 60% PS gradient. The intermediate interface of it has schizonts (32–48 h) accounting for approximately 71.53% of the parasites present and the pellet contains mostly early-stage parasites, with 91.64% ring-stage (0–18 h) purity (
Fig. 2E). This visible stratification suggested a more refined fractionation of parasite components. Giemsa-stained microscopic analysis revealed a substantial difference in sample purity between the gradient centrifugation and Plasmion-based methods. The Plasmion synchronization method resulted in a final product containing a significant proportion of uninfected erythrocytes. The percentage of parasites with/without synchronization determined by Giemsa-stained microscopic analysis was displayed in
Supplementary Fig. S2.
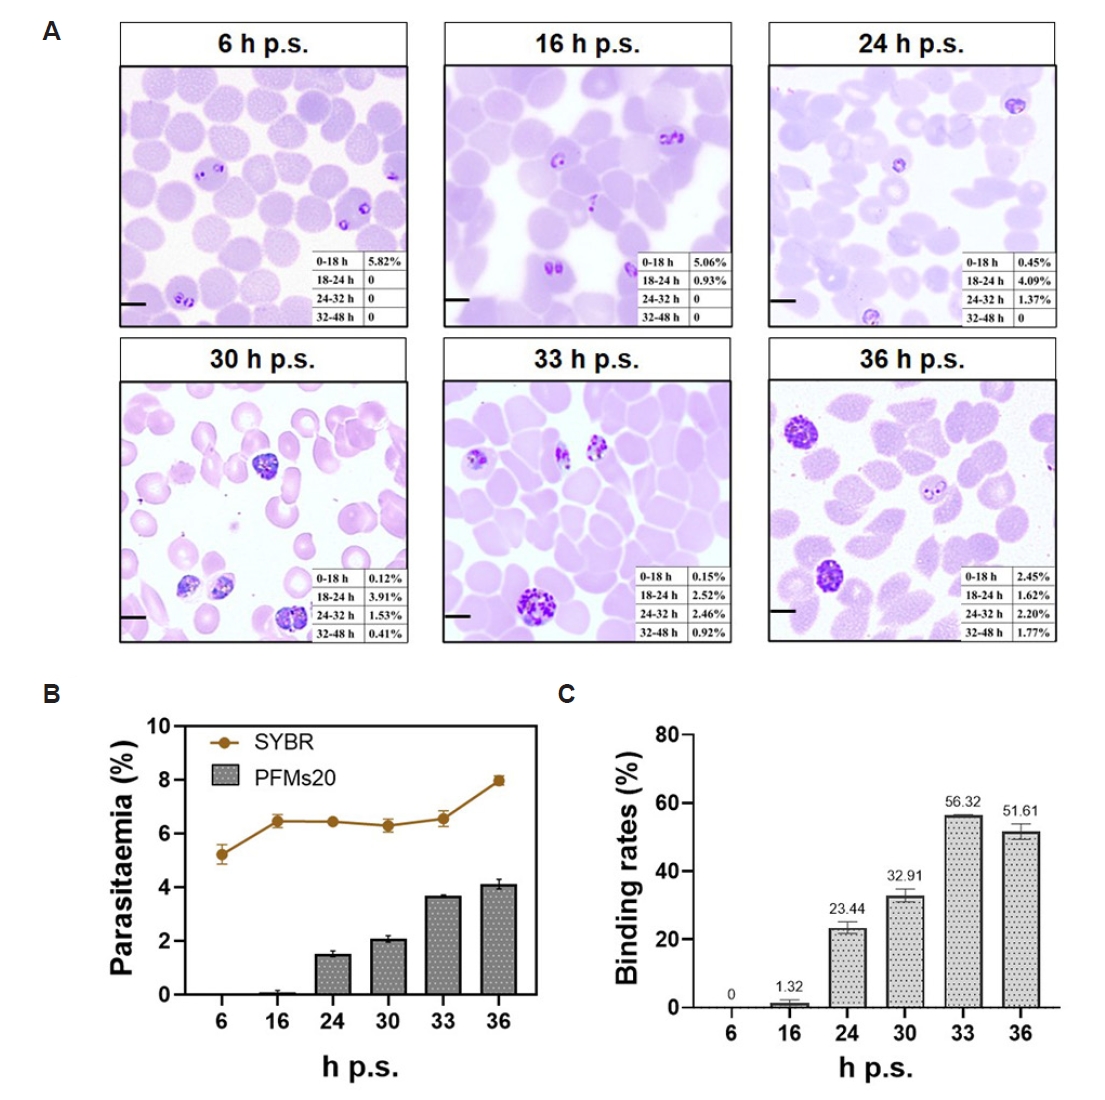
To delineate the relationship between parasite stage and PFMs20 binding, highly synchronized
P. falciparum cultures were analyzed at 6, 16, 24, 30, 33, and 36 h post synchronization (h p.s.) following 2 rounds of 5% D-sorbitol synchronization. Giemsa-stained thin smears were examined at each time point, with parasites classified into 4 developmental windows based on morphology and hours post-invasion (h p.i.): 0–18 h (rings), 18–24 h (early trophozoites), 24–32 h (late trophozoites), and 32–48 h (schizonts, ≥3 nuclei). As shown in
Fig. 3A, the parasite population progressed synchronously through the intraerythrocytic stages. At 6 h p.s., the culture was dominated by rings (0–18 h, 5.82%). By 24 h p.s., parasites had transitioned to trophozoite stages, with early and late trophozoites comprising 4.09% and 1.37%, respectively. Schizonts (32–48 h) first became detectable at 30 h p.s. (0.41%) and increased through 36 h p.s. (1.77%), confirming successful and sustained synchronization.
The parasitemia, as measured by SYBR Green I staining, remained stable at a low level (approximately 5%–6%) throughout the observation period. However, the absolute PFMs20 binding rate to the total RBC population was even lower and showed only a modest increase at 24 h (
Fig. 3B). Analysis of binding specificity to infected RBCs (iRBCs) demonstrated striking stage-dependent kinetics (
Fig. 3C). PFMs20 binding efficiency rose to 23.44% at 24 h p.s., a much more substantial peak was observed at 33 h p.s. (56.32%). The binding efficiency reached its maximum at 33-36 h p.s., indicating that PFMs20 binding is a definitive marker for the late trophozoite and schizont stages of intraerythrocytic development. Quantification of PFMs20 binding efficiency across various intraerythrocytic developmental stages, showing how the binding rate changes with hours of development (
Supplementary Fig. S3).
To further probe the dependence of PFMs20 binding on NPPs activity, we treated late‑stage cultures with the NPPs inhibitor furosemide sodium. Furosemide exposure led to a marked reduction of PFMs20 positive events (to ~10%), compared with DMSO‑treated and -untreated infected erythrocytes (both ~45%–50%), while SYBR Green I positive parasitemia remained largely unchanged (
Supplementary Fig. S4). These data support that PFMs20 binding to infected RBCs is strongly dependent on NPPs function rather than on parasite presence.
The 4 synchronization methods on
P. falciparum 3D7 cultures were evaluated. Representative dot plots of PFMs20 (
Fig. 4A) and overlaid histogram of iRBCs obtained from staining with SYBR Green I (
Fig. 4B) and quantitative data (
Supplementary Table S1) demonstrate distinct binding profiles depending on the synchronization strategy and developmental stage. Uninfected RBCs displayed minimal background signal.
As shown in
Fig. 4 and
Supplementary Table S1, binding efficiency varied significantly depending on the developmental stage and the synchronization protocol used. Due to the presence of mixed developmental stages, the pre-synchronized culture exhibited high binding rate (39.78±6.09%) (
Supplementary Fig. S5). For ring-stage parasites, all synchronization methods resulted in significantly reduced PFMs20 binding, with 5% D-sorbitol, 60% PS (lower layer), and 70%–40% PS (lower layer) showing particularly low binding rates (9.01±2.85%, 6.07±1.83%, and 8.46±0.71%, respectively). Plasmion protocol retained relatively higher ring-stage binding (22.58±1.18%), indicating less efficient stage selection. The non-zero binding rate might be because performing synchronization in the mixed-stage state could lead to incomplete synchronization, with residual late-stage parasites.
In contrast, late-stage parasites (late trophozoites and schizonts) isolated from the upper layers of the Percoll-based gradients exhibited very high PFMs20 binding rates. Parasites isolated from the 60% PS upper layer showed a PFMs20 positivity rate as high as 84.17±0.95%, and similarly, the positivity rate from the 70%–40% PS upper layer was 78.72±1.00%. The positive rate of SYBR Green I using the upper layer of 60% PS was 98.07±0.11% and the upper layer of the 70%–40% PS also showed high efficiency, with a positive rate of 91.10±0.26%. The upper layers from the 60% PS and 70%–40% PS showed the highest binding efficiencies (85.83±0.97% and 86.41±1.10%, respectively), confirming successful enrichment of late stages and strong PFMs20 affinity. Plasmion treatment also resulted in high late-stage binding (73.62±2.09%) but with slightly lower SYBR Green I and PFMs20 signal intensities (38.30±0.23% and 28.20±0.80%, respectively), indicating moderate enrichment efficiency.
Statistical comparison via one-way ANOVA confirmed that the choice of synchronization protocol is a critical determinant of efficiency for both key developmental windows. A significant overall effect was found for early-stage parasite enrichment as well as for late-stage parasite enrichment. The validity of both ANOVA models was supported by non-significant Brown-Forsythe tests (both
P>0.05), confirming the homogeneity of variances. For the parasites in the lower layer, Tukey’s post hoc test revealed that Plasmion method yielded a significantly higher binding rate compared to each of the other 3 methods (5% D-sorbitol, 60% PS, and 70%–40% PS), with all pairwise comparisons showing
P<0.0001. In contrast, no significant differences were observed among the 5% D-sorbitol, 60% PS, and 70%–40% PS methods themselves (all adjusted
P>0.05). For the parasites in the upper layer, Tukey’s multiple comparisons test identified the specific pairwise differences: both the 60% PS and 70%–40% PS methods yielded significantly higher late-stage recovery rates than the Plasmion method (
P=0.0001 for both comparisons). In contrast, no significant difference was found between the 60% PS and 70%–40% PS methods (
P=0.8804) (
Fig. 4C).
We compared the positive rates obtained with SYBR Green I and PFMs20 across 4 commonly used synchronization protocols in both early- and late-stage parasites. For early-stage parasites, the SYBR Green I‑based parasitemia (
Supplementary Fig. S6A) varied significantly depending on the synchronization method (one‑way ANOVA,
P<0.0001). Post‑hoc Tukey’s test revealed that parasites synchronized with 5% D‑sorbitol exhibited a markedly lower SYBR Green I‑positive rate compared to those treated with Plasmion, 60% PS, or 70%–40% PS (all
P<0.0001). A similar trend was observed with PFMs20 binding (
Supplementary Fig. S6B), where the synchronization protocol also significantly affected the measured binding rate. Plasmion synchronization resulted in the highest PFMs20‑positive percentage, which was significantly greater than that obtained with 5% D‑sorbitol or 60% PS. For late-stage parasites, Plasmion synchronization yielded the lowest detection rates for both SYBR Green I and PFMs20, with significant differences compared to 60% PS and 70%–40% PS (all
P<0.0001).
We identified the predominant stages isolated by each method. This graphical representation highlights the temporal distribution of asexual blood stages obtained using 5% D-sorbitol, 60% PS, 70%–40% PS, and Plasmion fractionation (
Fig. 5). The thickness of the lines corresponds to the relative abundance of parasites at a given stage and time, with thicker lines indicating a higher proportion of the population. Solid lines represent intervals where the majority of parasites reside at a specific stage, while dashed lines indicate periods with a minority presence. Three methods can effectively separate ring-stage parasites from late-stage parasites (trophozoites/schizonts) in in vitro cultures of
P. falciparum, namely 60% PS, 70%–40% PS, and Plasmion. The 5% D-sorbitol treatment (a) yielded a tight ring-stage population centered around 0–16 h postinvasion, with limited progression into later stages. In contrast, 60% PS (b, c) and 70%–40% PS (d, e) protocols enabled effective separation of early and late stages. Parasites collected from the upper layers of these gradients (b, d) were predominantly late trophozoites and schizonts (~32–48 h), while lower layers (c, e) contained rings (~0–16 h), indicating high stage selectivity. The Plasmion method showed broader stage distribution. Parasites from the upper layer (f) spanned from trophozoites to schizonts (~27–48 h), but with more overlap into mid-stages. The lower layer (g) still contained ring stages, but their synchrony was less defined compared to Percoll-based methods.
Discussion
In this study, 4 commonly used synchronization methods were compared by Giemsa staining counting and flow cytometry. We incorporated PFMs20, which bind to live parasites specifically after the formation of NPPs [
14], to assess the developmental stages of
Plasmodium parasites, thereby enhancing the objectivity of stage determination compared to morphological analysis alone.
Sorbitol synchronization leverages the osmotic fragility of mature trophozoites and schizonts [
19]. A hypertonic sorbitol solution (5% w/v) selectively lyses infected erythrocytes containing late-stage parasites, as these stages exhibit increased membrane permeability and hemoglobin degradation, rendering them vulnerable to osmotic shock [
20]. The 5% D-sorbitol synchronization method was employed to obtain more consistent ring-stage parasites when ring-stage parasites comprised >70% of parasitemia [
21]. It is the most common method used by researchers to obtain ring-stage parasites that allows in vitro malaria drug sensitivity experiments [
22]. Advantages of this method include inexpensive reagents and simple operation. After treatment, the parasites were washed thoroughly to remove all traces of sorbitol [
23].
Another synchronization method using a discontinuous gradient of Percoll with sorbitol relies on differential density for physical separation [
24]. This method relies on density differences between erythrocytes infected with distinct parasite stages [
25]. Mature schizonts, which digest host hemoglobin to produce hemozoin crystals, increase the density of iRBCs, enabling their separation via isosmotic Percoll gradients. Early rings, with minimal hemozoin, remain in lower-density fractions [
16]. The Percoll solution was prepared in D-sorbitol instead of standard buffers to establish an isotonic density gradient and prevent osmotic damage to the parasites during the centrifugation process. This ensures the isolation of viable, functionally intact late-stage parasites for downstream applications. There were also differences in enrichment for late trophozoites and schizonts between the 2 main discontinuous gradients of Percoll with sorbitol synchronization methods we used. The 70%–40% PS, while excellent for isolating highly mature schizonts, resulted in slightly lower SYBR Green I and PFMs20 positivity rates compared to the 60% PS method. One possible explanation is that the very mature schizonts enriched by the 70%–40% PS protocol have an increased tendency to rupture during the centrifugation and resuspension steps, thereby releasing free merozoites. These merozoites are substantially smaller than intact infected red blood cells and exhibit light‑scattering properties similar to cellular debris; they are therefore likely to fall outside the flow‑cytometry gate defined for intact RBCs, which would lead to an underestimation of parasite‑positive events. For this synchronization protocol, parasites must be predominant in the schizont stage to obtain optimal results [
26]. Compared with the 60% PS protocol, the 70%–40% PS method enables the additional separation of the pigment layer, thereby yielding late-stage parasites with higher purity.
Using Plasmion can enrich cultures for later stage parasites. This method is based on the slower sedimentation rate of late trophozoites and schizonts from K+ (knob-expressing) strains [
27], thus allowing their separation from earlier parasite stages and from uninfected erythrocytes. Plasmion, a plasma substitute used in hospitals for hypovolaemia, is used in place of Plasmagel [
9]. Plasmion method is superior to Percoll-gradient methods for the purification of mature parasitized erythrocytes for invasion studies of some parasite isolates due to differences in sensitivity to sorbitol [
28]. While the significant contamination with uninfected erythrocytes following Plasmion synchronization, a drawback not observed with the highly pure Percoll-gradient methods, must be considered when selecting a protocol for downstream applications sensitive to sample purity. Our correlative microscopy data revealed that microsphere binding was stage-dependent, with trophozoites and schizonts showing high binding efficiency. The binding rate of PFMs20 increased significantly with the later stage of
Plasmodium parasites. Through the PFMs20 binding rate, we found that the Plasmion method was inefficient in obtaining ring-stage parasites. Plasmion‑treated samples show a modest rightward shift in fluorescence intensity compared with other synchronization methods and note that the underlying mechanism remains unclear. Importantly, for both SYBR Green I staining and PFMs20, the gates for positive parasite populations were defined relative to the corresponding Plasmion‑treated RBCs controls run in parallel. Thus, all comparisons are made within experiments using RBC‑based gating, and the observed rightward shift does not affect population assignment or the conclusions drawn from the flow cytometry data.
Based on a comprehensive comparison of microscopic and flow cytometric results, 5% D-sorbitol synchronization proved to be the optimal method for obtaining highly synchronized ring-stage parasites, owing to its operational stability and minimal time consumption. In contrast, both the 60% PS and 70%–40% PS methods require more expensive reagents than other techniques. Furthermore, their procedures are complex and demand a high level of technical skill from the experimenter. Although the Plasmion method is relatively low-cost, it yields impure populations in both the upper and lower layers. The choice of synchronization method entails a trade-off between yield and stage-purity. While 5% D-sorbitol yields the purest ring-stage parasites, it does so at the cost of a significant reduction in total parasite numbers due to the osmotic lysis of mature stages. In contrast, Plasmion enrichment maximizes the recovery of live parasites but results in a mixture containing a substantial fraction of uninfected erythrocytes. Density gradient centrifugation (60% PS and 70%–40% PS) strikes a balance, offering high purity of mature stages with a moderate yield loss attributable to the mechanics of gradient fractionation. Therefore, for obtaining pure late-stage trophozoites, the 70%–40% PS method remains the superior choice due to its higher enrichment purity (
Table 1).
The binding efficiency of our PFMs20 showed a minor discrepancy compared to previous reports [
14], a common challenge often stemming from batch-to-batch variability in nanomaterial synthesis. This observation underscores that material stability and standardization are not merely beneficial but crucial for advancing the field of stage-targeted malaria research, ensuring that results are comparable and meaningful across different laboratories. Our assessment of synchronization efficacy and parasite loss relied on morphological analysis and flow cytometry. These are widely used and robust approaches for stage classification and relative parasitemia, but they do not directly provide an absolute measure of parasite biomass. In principle, molecular quantification (e.g., qPCR of parasite rRNA) could complement these readouts; however, implementing such assays in parallel for all time points and all synchronization procedures was beyond the logistical and time constraints of the present study. We therefore chose to focus on methods that are readily accessible to most malaria laboratories and are sufficient for a comparative evaluation of synchronization performance. While we observed clear differences in PFMs20 binding kinetics between methods, the underlying mechanism remains uncertain. We therefore limit ourselves to describing the observed patterns and do not draw firm conclusions about specific membrane permeability changes or other cellular processes that might account for these differences. However, definitive confirmation requires further mechanistic studies. Finally, our findings are based on the
P. falciparum 3D7 strain cultured under standard conditions. The generalizability of our conclusions to other genetically distinct parasite strains (e.g., field isolates or drug-resistant strains), which may exhibit different membrane properties or developmental kinetics, remains to be determined.
Notes
-
Author contributions
Conceptualization: Lu F. Data curation: Deng Y, Xu J. Formal analysis: Deng Y, Yin Y, Li Y, Lu F. Funding acquisition: Lu F, Liu Y. Investigation: Deng Y, Yin Y, Li Y. Methodology: Deng Y, Yin Y, Li Y, Xu J, Han J, Liu Y, Lu F. Project administration: Lu F, Liu Y. Resources: Lu F, Liu Y. Software: Deng Y, Xu J, Han J. Supervision: Lu F, Liu Y. Validation: Deng Y, Yin Y, Li Y, Xu J, Han J. Visualization: Deng Y, Yin Y. Writing - original draft: Deng Y, Yin Y. Writing - review & editing: Deng Y, Lu F, Liu Y, Han J.
-
Conflict of interest
Jin-Hee Han serves as an editor of Parasites, Hosts and Diseases but had no involvement in the decision to publish this article. No other potential conflicts of interest relevant to this study were reported.
-
Funding
This study was supported by the Jiangsu Province Capability Improvement Project through Science, Technology, and Education (No. ZDXYS202207), the Open Project of National Health Commission Key Laboratory of Parasitic Disease Control and Prevention (No. wk023-010), the Postgraduate Research & Practice Innovation Program of Jiangsu Province (KYCX24-3849), and the Yangzhou University International Academic Exchange Fund (No. YZUF2024218). The funders had no role in study design, data collection and analysis, decision to publish, or preparation of the manuscript.
Supplementary Information
Fig. 1.Workflow and operational parameters for synchronizing Plasmodium falciparum cultures. Schematics depict the core steps for 4 synchronization protocols: 5% D-sorbitol (osmotic lysis), 60% PS (isopycnic centrifugation), 70%–40% PS (discontinuous density gradient centrifugation), and Plasmion (buoyancy-based separation). Critical parameters (centrifugation force, duration, and temperature) are annotated for each method.

Fig. 2.Comparative analysis of synchronization methods for Plasmodium falciparum. (A) Giemsa stained thick (right) and thin (left) blood smears of asynchronous P. falciparum cultures prior to synchronization. (B-E) Parasites after treatment with (B) 5% D-sorbitol: thick (right) and thin (left) blood smears; (C) Plasmion reagent: (a) supernatant enriched in late trophozoites/schizonts, (b) pellet with ring/early trophozoite mixture; (D) isosmotic Percoll-Sorbitol (60% v/v) (60% PS): (c) upper layer with schizonts, (d) pellet with rings; (E) discontinuous Percoll-Sorbitol gradients (70%/40%) (70%–40% PS): (e) interface layer with schizonts, (f) pellet with rings. For all panels (C-E), thin smears are shown on the upper part and thick smears on the lower part. Micrographs highlight stage-specific synchronicity achieved with these methods. Scale bar=5 µm.
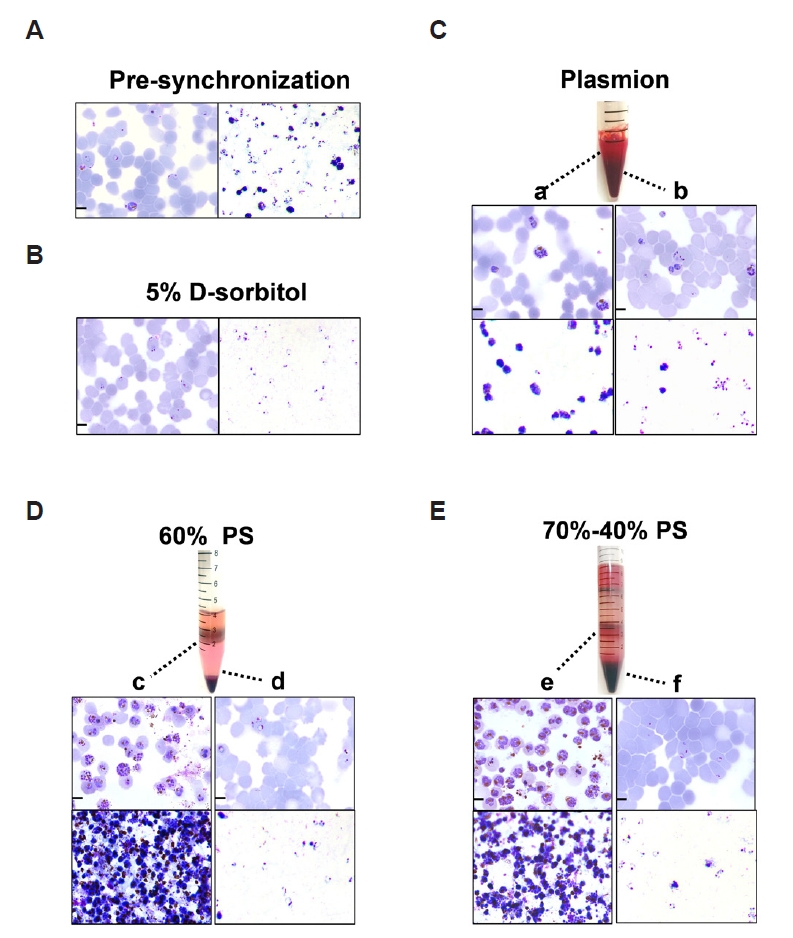
Fig. 3.Stage-specific binding kinetics of 20 nm polystyrene fluorescent microspheres (PFMs20) to Plasmodium falciparum–infected erythrocytes during intraerythrocytic development. (A) Giemsa-stained morphology for quantification of parasite developmental stages. Panels show the density and stage distribution of parasites at indicated hours post synchronization (h p.s.), with insets detailing the proportional composition of each developmental stage. Parasite staging was defined morphologically as follows: Rings: early forms with a single chromatin dot and minimal cytoplasm, predominant from 0–18 h; Trophozoites: enlarged, amoeboid forms with a single nucleus and active hemoglobin digestion, typically observed from 18–32 h; Schizonts: multinucleated forms with ≥3 distinct nuclei, appearing from 32–48 h. The 32-h time point denotes the morphological transition into the schizont stage. (B) Comparative kinetics of total parasitemia and PFMs20 binding to the total RBC population. The line graph plots parasitemia (%, percentage of SYBR Green I⁺ infected RBCs). The bar graph shows the PFMs20 binding rate (%, percentage of PFMs20⁺ cells within the total RBC population). (C) PFMs20 binding efficiency (%, percentage of PFMs20⁺ cells within the SYBR Green I⁺ infected RBC population), representing the stage-specific binding affinity to parasitized cells. Scale bar=5 µm.

Fig. 4.Flow cytometry results of 20 nm polystyrene fluorescent microspheres (PFMs20) and SYBR Green I. (A) Gating strategy and binding efficiency of PFMs20 across intraerythrocytic developmental stages. RBC populations were first gated based on side scatter-area (SSC-A) and forward scatter-area properties, followed by analysis of fluorescein isothiocyanate-area (FITC-A) fluorescence (PFMs20 staining). The lower and upper layers after gradient separation indicate different parasite developmental stages. (B) Proportion of parasitized RBCs determined by SYBR Green I nuclear staining following synchronization with different methods: 5% D-sorbitol, isosmotic Percoll-Sorbitol (60% v/v) (60% PS), discontinuous Percoll-Sorbitol gradients (70%/40%) (70%–40% PS), and Plasmion-based separation. (C) Binding rates of PFMs20 to parasites synchronized using the indicated methods. The binding rate was calculated as the ratio of PFMs20-positive parasites to SYBR Green I-positive parasites. Error bars represent standard deviation from 3 independent experiments. ***P<0.0001. ns, not significant.
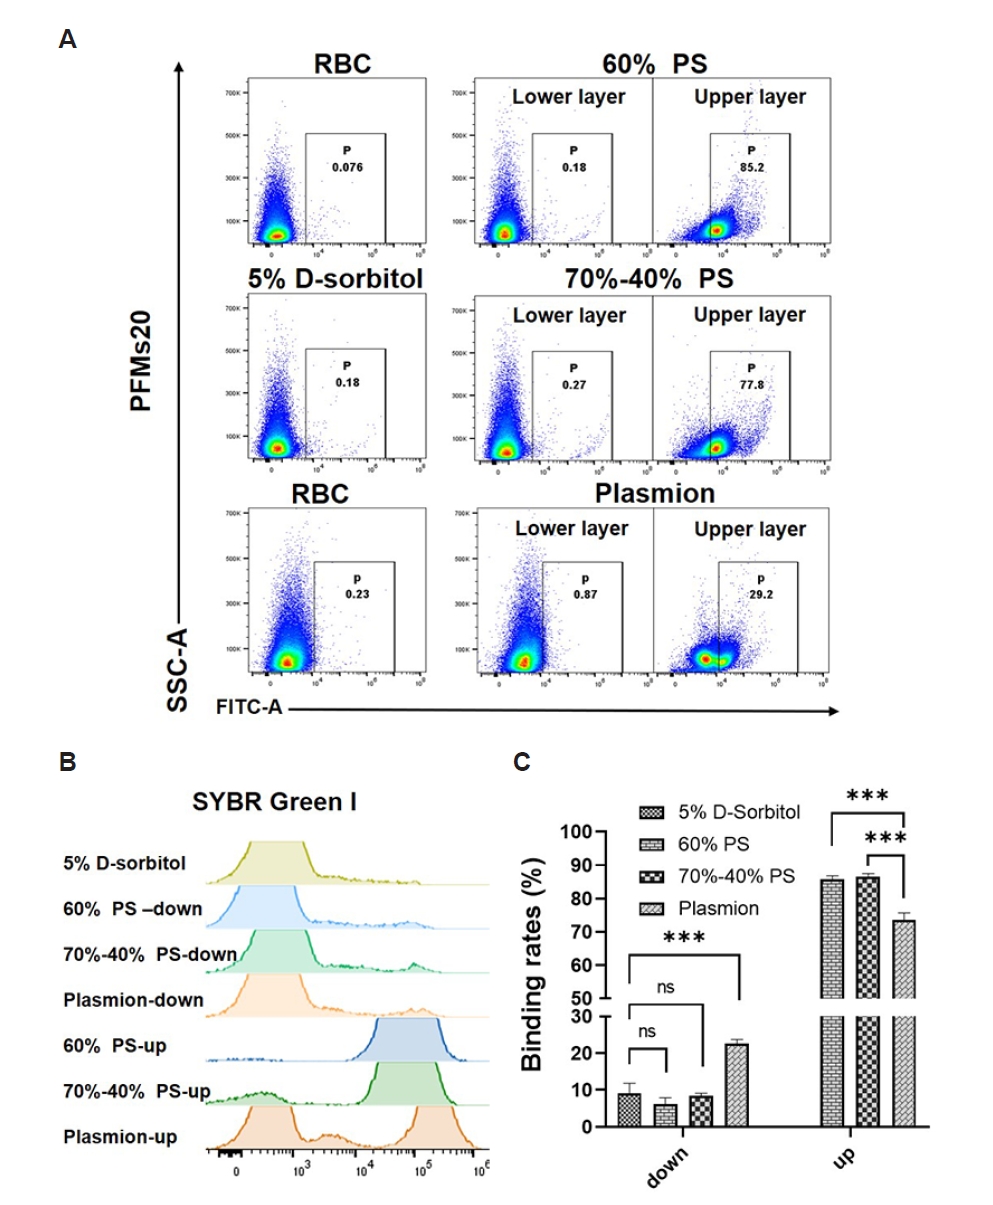
Fig. 5.Graphical representation of Plasmodium falciparum main parasites stages obtained by 4 methods of synchronization. Solid lines indicate time windows during which the majority of parasites are found at a particular stage. Dashed lines indicate periods with fewer parasites present. The temporal distribution was estimated based on microscopic examination of Giemsa-stained blood smears. (a) 5% D-sorbitol; (b) isosmotic Percoll-Sorbitol (60% v/v) (60% PS)-up, (c) 60% PS-down; (d) discontinuous Percoll-Sorbitol gradients (70%/40%) (70%–40% PS)-up, (e) 70%–40% PS-down; (f) Plasmion-up, (g) Plasmion-down.
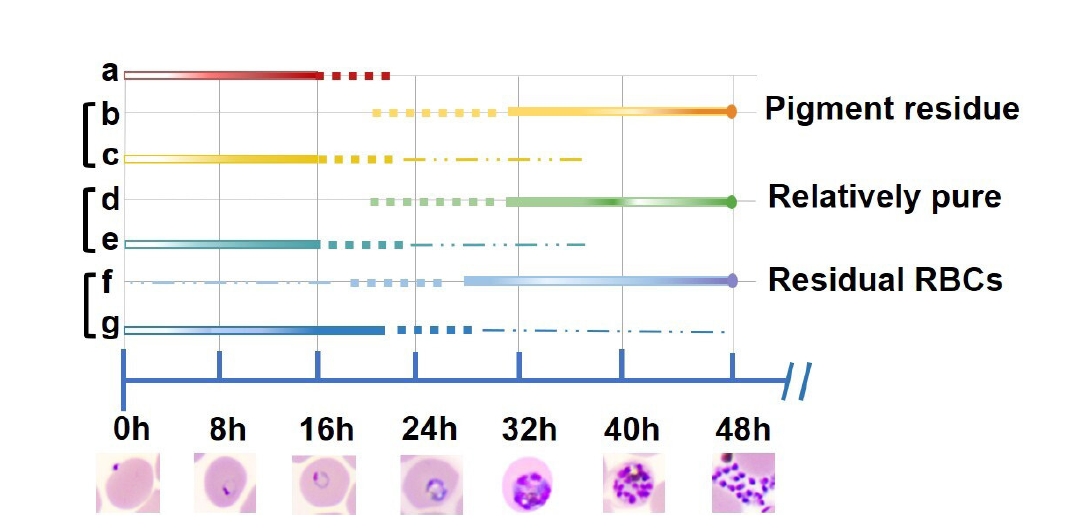
Table 1.Comparison of 4 synchronization methods
Table 1.
|
Methods |
5% D-sorbitol |
60% PS |
70%–40% PS |
Plasmion |
|
Special reagents and instruments |
D-sorbitol |
Percoll and D-sorbitol |
Percoll and D-sorbitol |
Gelatin |
|
Principle |
Hypertonic shock induces preferential rupture of trophozoite/schizont-infected RBCs |
Homogeneous 60% Percoll/5% Sorbitol medium enables schizont isolation at equilibrium density |
Step gradient separates stages by differential sedimentation velocity through density transition zones |
Density gradient enrichment of trophozoites/schizonts using Plasmion medium |
|
Target stage |
Rings |
Late trophozoites/schizonts |
Late trophozoites/schizonts |
Trophozoites/schizonts |
|
Target stage purity (%) |
>90% (when rings dominate initially) |
>65% |
>70% |
>60% |
|
Parasite recovery (%) (percentage of target stage parasites recovered) |
>85% |
~85% |
~80% |
>40% |
|
Time consumed (h) |
1~1.5 |
1.5~2 |
2~2.5 |
1.5~2 |
|
Cost of packed iRBC ($/ml) |
<0.5 |
~1.5 |
~1.1 |
<0.5 |
|
Precautions when operating |
The reagent should not act for too long |
Reagents need to be added slowly against the wall of the tube |
Keep the tube upright during the water bath |
|
Advantages |
Rapid and inexpensive |
Good schizont yield and low uninfected RBC contamination |
Capable of isolating distinct hemozoin layers |
Gentle on parasites |
|
Disadvantages |
Yields lower recovery when non‑ring stages dominate, due to osmotic lysis |
Does not separate hemozoin layers |
Technically more demanding |
Yields samples with substantial uninfected RBC |
References
- 1. Tahlan S, Singh S, Kaira M, Dey H, Pandey KC. A progress report in advancements of heterocyclic compounds as novel antimalarial agents over the last 5 years. Eur J Med Chem 2025;289:117393. https://doi.org/10.1016/j.ejmech.2025.117393
- 2. Michel M, Skourtanioti E, Pierini F, et al. Ancient Plasmodium genomes shed light on the history of human malaria. Nature 2024;631:125-33. https://doi.org/10.1038/s41586-024-07546-2
- 3. Souleiman Y, Ismail L, Eftimie R. Modeling and investigating malaria P. Falciparum and P. Vivax infections: application to Djibouti data. Infect Dis Model 2024;9:1095-116. https://doi.org/10.1016/j.idm.2024.06.003
- 4. Sato S. Plasmodium-a brief introduction to the parasites causing human malaria and their basic biology. J Physiol Anthropol 2021;40:1. https://doi.org/10.1186/s40101-020-00251-9
- 5. Camponovo F, Lee TE, Russell JR, et al. Mechanistic within-host models of the asexual Plasmodium falciparum infection: a review and analytical assessment. Malar J 2021;20:309. https://doi.org/10.1186/s12936-021-03813-z
- 6. Rudlaff RM, Kraemer S, Streva VA, Dvorin JD. An essential contractile ring protein controls cell division in Plasmodium falciparum. Nat Commun 2019;10:2181. https://doi.org/10.1038/s41467-019-10214-z
- 7. Greischar MA, Reece SE, Savill NJ, Mideo N. The challenge of quantifying synchrony in malaria parasites. Trends Parasitol 2019;35:341-55. https://doi.org/10.1016/j.pt.2019.03.002
- 8. Ciuffreda L, Zoiku FK, Quashie NB, Ranford-Cartwright LC. Estimation of parasite age and synchrony status in Plasmodium falciparum infections. Sci Rep 2020;10:10925. https://doi.org/10.1038/s41598-020-67817-6
- 9. Ranford-Cartwright LC, Sinha A, Humphreys GS, Mwangi JM. New synchronization method for Plasmodium falciparum. Malar J 2010;9:170. https://doi.org/10.1186/1475-2875-9-170
- 10. Ngernna S, Chim-Ong A, Roobsoong W, et al. Efficient synchronization of Plasmodium knowlesi in vitro cultures using guanidine hydrochloride. Malar J 2019;18:148. https://doi.org/10.1186/s12936-019-2783-1
- 11. Carmo OMS, Dixon MWA. VAR2CSA ectodomain labeling in Plasmodium falciparum infected red blood cells and analysis via flow cytometry. Bio Protoc 2023;13:e4725. https://doi.org/10.21769/BioProtoc.4725
- 12. Bozdech Z, Llinás M, Pulliam BL, et al. The transcriptome of the intraerythrocytic developmental cycle of Plasmodium falciparum. PLoS Biol 2003;1:E5. https://doi.org/10.1371/journal.pbio.0000005
- 13. Wakoli DM, Ondigo BN, Ochora DO, et al. Impact of parasite genomic dynamics on the sensitivity of Plasmodium falciparum isolates to piperaquine and other antimalarial drugs. BMC Med 2022;20:448. https://doi.org/10.1186/s12916-022-02652-2
- 14. Xu J, Hu F, Li S, et al. Fluorescent nitrogen-doped carbon dots for label live elder blood-stage Plasmodium falciparum through new permeability pathways. Molecules 2022;27:4163. https://doi.org/10.3390/molecules27134163
- 15. Trager W, Jensen JB. Human malaria parasites in continuous culture. Science 1976;193:673-5. https://doi.org/10.1126/science.781840
- 16. Childs RA, Miao J, Gowda C, Cui L. An alternative protocol for Plasmodium falciparum culture synchronization and a new method for synchrony confirmation. Malar J 2013;12:386. https://doi.org/10.1186/1475-2875-12-386
- 17. Ahn SY, Shin MY, Kim YA, et al. Magnetic separation: a highly effective method for synchronization of cultured erythrocytic Plasmodium falciparum. Parasitol Res 2008;102:1195-200. https://doi.org/10.1007/s00436-008-0893-8
- 18. Kulkeaw K. Progress and challenges in the use of fluorescence-based flow cytometric assays for anti-malarial drug susceptibility tests. Malar J 2021;20:57. https://doi.org/10.1186/s12936-021-03591-8
- 19. Lambros C, Vanderberg JP. Synchronization of Plasmodium falciparum erythrocytic stages in culture. J Parasitol 1979;65:418-20.
- 20. Nguitragool W, Bokhari AA, Pillai AD, et al. Malaria parasite clag3 genes determine channel-mediated nutrient uptake by infected red blood cells. Cell 2011;145:665-77. https://doi.org/10.1016/j.cell.2011.05.002
- 21. Klaus S, Binder P, Kim J, et al. Asynchronous nuclear cycles in multinucleated Plasmodium falciparum facilitate rapid proliferation. Sci Adv 2022;8:eabj5362. https://doi.org/10.1126/sciadv.abj5362
- 22. Kiboi D, Sá JM, Nayak A, et al. Isolation and characterization of Plasmodium falciparum blood-stage persisters by improved selection protocols using dihydroartemisinin alone. Antimicrob Agents Chemother 2025;69:e0005324. https://doi.org/10.1128/aac.00053-24
- 23. Spadafora C, Gerena L, Kopydlowski KM. Comparison of the in vitro invasive capabilities of Plasmodium falciparum schizonts isolated by Percoll gradient or using magnetic based separation. Malar J 2011;10:96. https://doi.org/10.1186/1475-2875-10-96
- 24. Platon L, Baker DA, Ménard D. Modified Plasmodium falciparum ring-stage survival assay with ML10 kinase inhibitor. Antimicrob Agents Chemother 2023;67:e0001723. https://doi.org/10.1128/aac.00017-23
- 25. Nillni EA, Londner MV, Spira DT. A simple method for separation of uninfected erythrocytes from those infected with Plasmodium berghei and for isolation of artificially released parasites. Z Parasitenkd 1981;64:279-84. https://doi.org/10.1007/BF00927375
- 26. Radfar A, Méndez D, Moneriz C, et al. Synchronous culture of Plasmodium falciparum at high parasitemia levels. Nat Protoc 2009;4:1899-915. https://doi.org/10.1038/nprot.2009.198
- 27. Lelièvre J, Berry A, Benoit-Vical F. An alternative method for Plasmodium culture synchronization. Exp Parasitol 2005;109:195-7. https://doi.org/10.1016/j.exppara.2004.11.012
- 28. Bates AH, Mu J, Jiang H, Fairhurst RM, Su XZ. Use of magnetically purified Plasmodium falciparum parasites improves the accuracy of erythrocyte invasion assays. Exp Parasitol 2010;126:278-80. https://doi.org/10.1016/j.exppara.2010.05.00