Abstract
Acanthamoeba spp. are known to cause human diseases such as granulomatous amoebic encephalitis and keratitis. These protozoa can persist in aquatic environments for extended periods and exhibit resistance to disinfectants used in water treatment, posing a significant threat to public health. Traditional culture and molecular methods have limitations in the rapid detection of viable Acanthamoeba in water. Therefore, we optimized real-time PCR (qPCR) combined with propidium monoazide (PMA) and evaluated the applicability of PMA-qPCR for the rapid detection of viable Acanthamoeba throughout the tap water production process. Using a PMA concentration of 50 µM, we successfully differentiated viable from non-viable cells and selected a 180-bp fragment of the 18S rRNA gene to enhance qPCR efficiency while minimizing amplification from non-viable cells. Application of PMA-qPCR to samples collected from each stage of the water treatment process, from raw water to purified water, enabled the detection of viable Acanthamoeba in samples with turbidity levels between 0.03 and 13.7 nephelometric turbidity units. These results demonstrate that PMA-qPCR is a suitable tool for monitoring pathogenic Acanthamoeba in drinking water supplies and enabling prompt responses to potential waterborne contamination events.
-
Key words: Acanthamoeba, propidium monoazide, real-time PCR, water treatment process
Introduction
Acanthamoeba spp. are free-living amoebae that are widely distributed in natural environments, including water, and cause diseases such as granulomatous amoebic encephalitis, cutaneous acanthamoebiosis, and keratitis in humans [
1].
Acanthamoeba has a 2-stage life cycle alternating between trophozoite and cyst forms. The cyst, characterized by a double-layered cell wall composed of cellulose, exhibits strong environmental resistance and prolonged survival, thereby maintaining pathogenic potential [
2,
3]. In particular, it can survive several stages of physical and chemical purification processes for tap water production, and its resistance to disinfectants such as chlorine and ozone can threaten a safe water supply [
2-
4]. In addition to its own pathogenicity,
Acanthamoeba can act as a reservoir for various pathogens. Many pathogens, such as
Legionella,
Mycobacteria, and other emerging pathogens, can proliferate within
Acanthamoeba while remaining protected during disinfectant and water treatment processes, which can play a role in spreading these pathogens [
5-
7]. Moreover, it is known that the virulence and drug resistance of pathogenic bacteria grown in
Acanthamoeba increase compared to those that are not [
8,
9]. Therefore, to protect public health and strengthen the safety of tap water, it is necessary to monitor
Acanthamoeba during both the water purification and tap water supply processes.
In general, cultivation has been applied to detect and quantify
Acanthamoeba in water. However, the method is complex as it involves several steps, including sample dilution, preparation of medium for seeding bacteria, sample inoculation, culture, and result reading [
10,
11]. In addition, damaged
Acanthamoeba cells are difficult to culture, and the analysis is time-consuming because of the 5-day to 7-day incubation period. Moreover, a high level of expertise is required to examine the cultures under a microscope [
10,
11].
Real-time PCR (qPCR), which has been widely used recently, is a rapid and sensitive method that is effective in quantifying
Acanthamoeba present in water. However, qPCR cannot distinguish between viable and non-viable of
Acanthamoeba, so it may underestimate the efficiency of the water purification process [
12]. This limitation can be overcome by combining qPCR with a nucleic acid intercalating dye such as propidium monoazide (PMA). This dye penetrates into cells with damaged cell membranes and irreversibly binds to DNA via photoactivation, ultimately preventing amplification by PCR [
13-
15]. There have been very few qPCR studies using PMA dye for the quantification of
Acanthamoeba, but since those studies were not conducted on environmental water, their applicability to actual field samples has not been evaluated [
16,
17].
Therefore, in this study, we optimized the PMA-qPCR method to quantify the viability of pathogenic Acanthamoeba, including both trophozoites and cysts, in water. In addition, we evaluated the applicability of PMA-qPCR to quickly monitor viable Acanthamoeba in the tap water supply process. Ultimately, PMA-qPCR is intended to be applied for rapid responses to infections caused by Acanthamoeba in water-related incidents and for evaluating the safety of water treatment processes.
Methods
Ethics statement
Not applicable.
Microorganisms
The
Acanthamoeba strains used in this study were
A. culbertsoni (ATCC 30171) and
A. polyphaga (ATCC 30461). The trophozoites were grown in proteose yeast glucose medium (20 g/L proteose peptone, 2 g/L yeast extract, 0.1 M glucose, 4 mM MgSO
4, 0.4 mM CaCl
2, 3.4 mM sodium citrate, 0.05 mM Fe(NH
4)
2(SO
4)
2, 2.5 mM Na
2HPO
4, and 2.5 mM KH
2PO
4; Sigma-Aldrich) at 27°C for 3 days [
18]. The trophozoites were harvested by centrifugation at 200 × g for 8 min and the resulting pellet was washed twice with sterile Page’s amoeba saline (2.05 mM NaCl, 0.016 mM MgSO
4∙7H
2O, 0.036 mM CaCl
2, 1 mM KH
2PO
4, and 1 mM Na
2HPO
4; Sigma-Aldrich) [
16]. For encystation of
Acanthamoeba, the pellet was then re-suspended in encystment medium (0.1 M KCl, 0.02 M Tris-HCl, 8 mM MgSO
4, 0.4 mM CaCl
2, 1 mM NaHCO
3; Sigma-Aldrich). This suspension was incubated at 25°C for 10 days [
11]. The cysts were harvested by centrifugation and stored at room temperature. The trophozoites and cysts were observed by light microscopy (Carl Zeiss).
To evaluate the ability of PMA-qPCR to quantify viable
Acanthamoeba, viable and non-viable cells were prepared. Viable cells were obtained by culturing the amoebae on non-nutrient agar (Oxoid) plates with 200 µl of
Escherichia coli (ATCC 11775) suspension at 30°C for 5 days [
16]. Non-viable cells were prepared the cell suspension by heating at 100°C for 5 min using a standard laboratory heat block. The heated cells were then cultured on non-nutrient agar plates with
E. coli and examined daily by microscopy throughout the incubation period to confirm the absence of viable cells. The densities of viable and non-viable cells were adjusted to approximately 10
4–10
8 cells/ml.
PMA (Biotum) was dissolved in 20% dimethyl sulfoxide (Sigma-Aldrich) to prepare a 20 mM stock solution. Given the limited research on PMA and amoebae, the concentration range was determined by referring to previous studies [
12-
17]. To evaluate the optimal PMA concentration, 500 μl samples containing either viable or non-viable
Acanthamoeba (trophozoites of
A. culbertsoni and
A. polyphaga or cysts of
A. culbertsoni) were treated with PMA at final concentrations of 0, 25, 50, 100, 150, and 200 μM. Furthermore, to assess whether the optimal PMA concentration varied with the initial target cell density, the samples were divided into low (10²–10³ copies per reaction) and high (10⁴–10⁵ copies per reaction) density groups prior to PMA treatment. The PMA-treated samples were incubated in the dark for 5 min with occasional mixing and then exposed on ice to a 650 W halogen lamp at a distance of 20 cm for 5 min [
13,
14,
19].
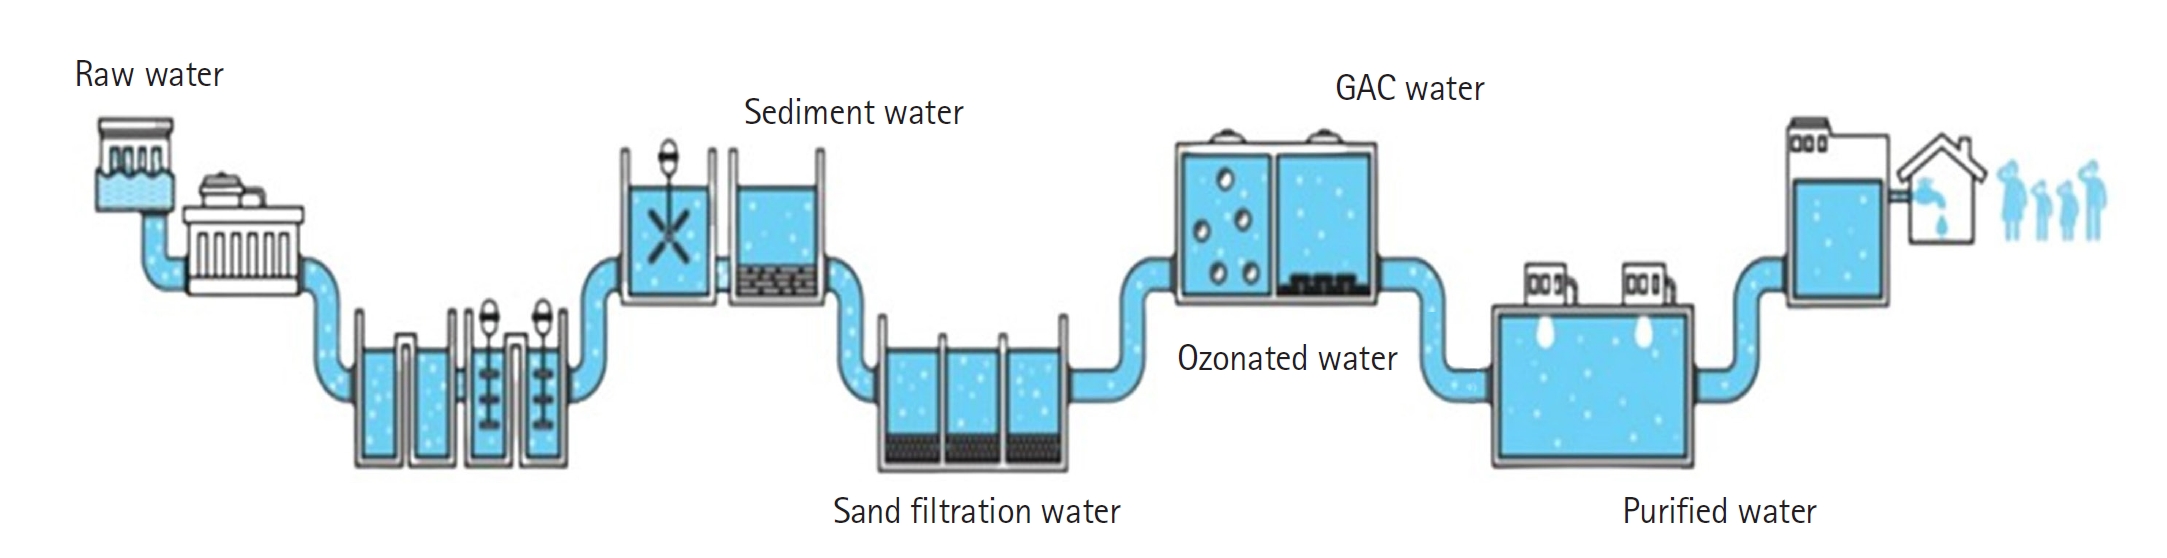
A total of 72 samples were collected and analyzed from each stage of the treatment process (raw water, sedimentation, sand filtration, ozonation, activated carbon filtration, and final purification) in water purification plant A, which produces tap water from the Han River in Seoul, Korea (
Fig. 1). To evaluate the seasonal characteristics of the samples, they were collected every month from December 2023 to November 2024. Each sample (2.5 L) was collected in a sterile sample bag, and 2 L of it was centrifuged at 4,000 × g for 15 min. After several stages of centrifugation, the final 1 ml concentrate was transferred to a 1.5-ml microcentrifuge tube and centrifuged at 12,000 × g for 5 min. The pellet was then re-suspended in 1 ml of sterile phosphate-buffered saline (PBS; pH 7.4, Sigma-Aldrich) and the resuspension was divided into 3 aliquots of 250 µl. Each of the first 2 samples was adjusted with sterile PBS to a final volume of 500 µl and used for PMA-qPCR and qPCR analysis. The remaining sample was spiked with 250 µl of viable
A. culbertsoni trophozoites and analyzed together to evaluate the applicability of PMA-qPCR for field samples. All samples were simultaneously analyzed for turbidity, expressed as nephelometric turbidity units (NTU, Hach), total organic carbon (Ionics), and residual chlorine (except for raw water, Hach), following the Korean standard method for water examination [
20].
PMA treated samples were washed with PBS and centrifuged at 12,000 rpm for 3 min. The total genomic DNA from the samples was extracted by the FastDNA SPIN Kit for Soil (MP Biomedicals) according to the manufacturer’s manual.
qPCR
qPCR was performed using a CFX Opus Real-Time PCR system (Bio-Rad). Primers and probes of 2 different sizes targeting the 18S rRNA gene were used to quantify
Acanthamoeba. To assess the analytical efficiency of the PMA‑qPCR assay in relation to amplicon size, 2 primer sets (yielding 180 bp and 420 bp amplicons) were applied to both viable and non‑viable
A. culbertsoni trophozoites (
Table 1) [
21,
22]. The qPCR mixture using a probe contained 12.5 µl of iQ Supermix (Bio-Rad), 0.2 µM of each forward and reverse primer, 0.1 µM of probe, 2 µl of extracted or standard DNA, and PCR-grade water in a 25-µl total volume. The qPCR mixture without a probe contained 12.5 µl of iQ SYBR Green Supermix (Bio-Rad), 0.2 µM of each forward and reverse primer, 2 µl of extracted or standard DNA, and PCR-grade water in a 25-µl total volume. The qPCR protocols were applied according to the respective references. A standard curve was generated using 10-fold serial dilutions of plasmid DNA containing the 18S rRNA gene of
A. culbertsoni (cloning by Macrogen), which served as a quantitative reference for subsequent qPCR assays. Through this comparative evaluation, the optimal primer sets for the
Acanthamoeba PMA-qPCR assay were selected.
All experiments were performed at least in duplicate, and the qPCR results were expressed as gene copy numbers calculated from a standard curve. The gene copy number data were log-transformed prior to statistical analysis. Statistical analyses were performed using Excel 2021 (Microsoft), and significance was evaluated using t-tests. Paired t-tests were conducted to compare the PMA-qPCR and qPCR results, as well as the spiked and detected copy numbers in the samples. Differences were considered statistically significant at P<0.05.
Results
Optimization of PMA-qPCR
To optimization PMA-qPCR conditions for selective detection of viable
Acanthamoeba cells, the effects of amplicon length, PMA concentration, and target cell density were evaluated (
Figs. 2-
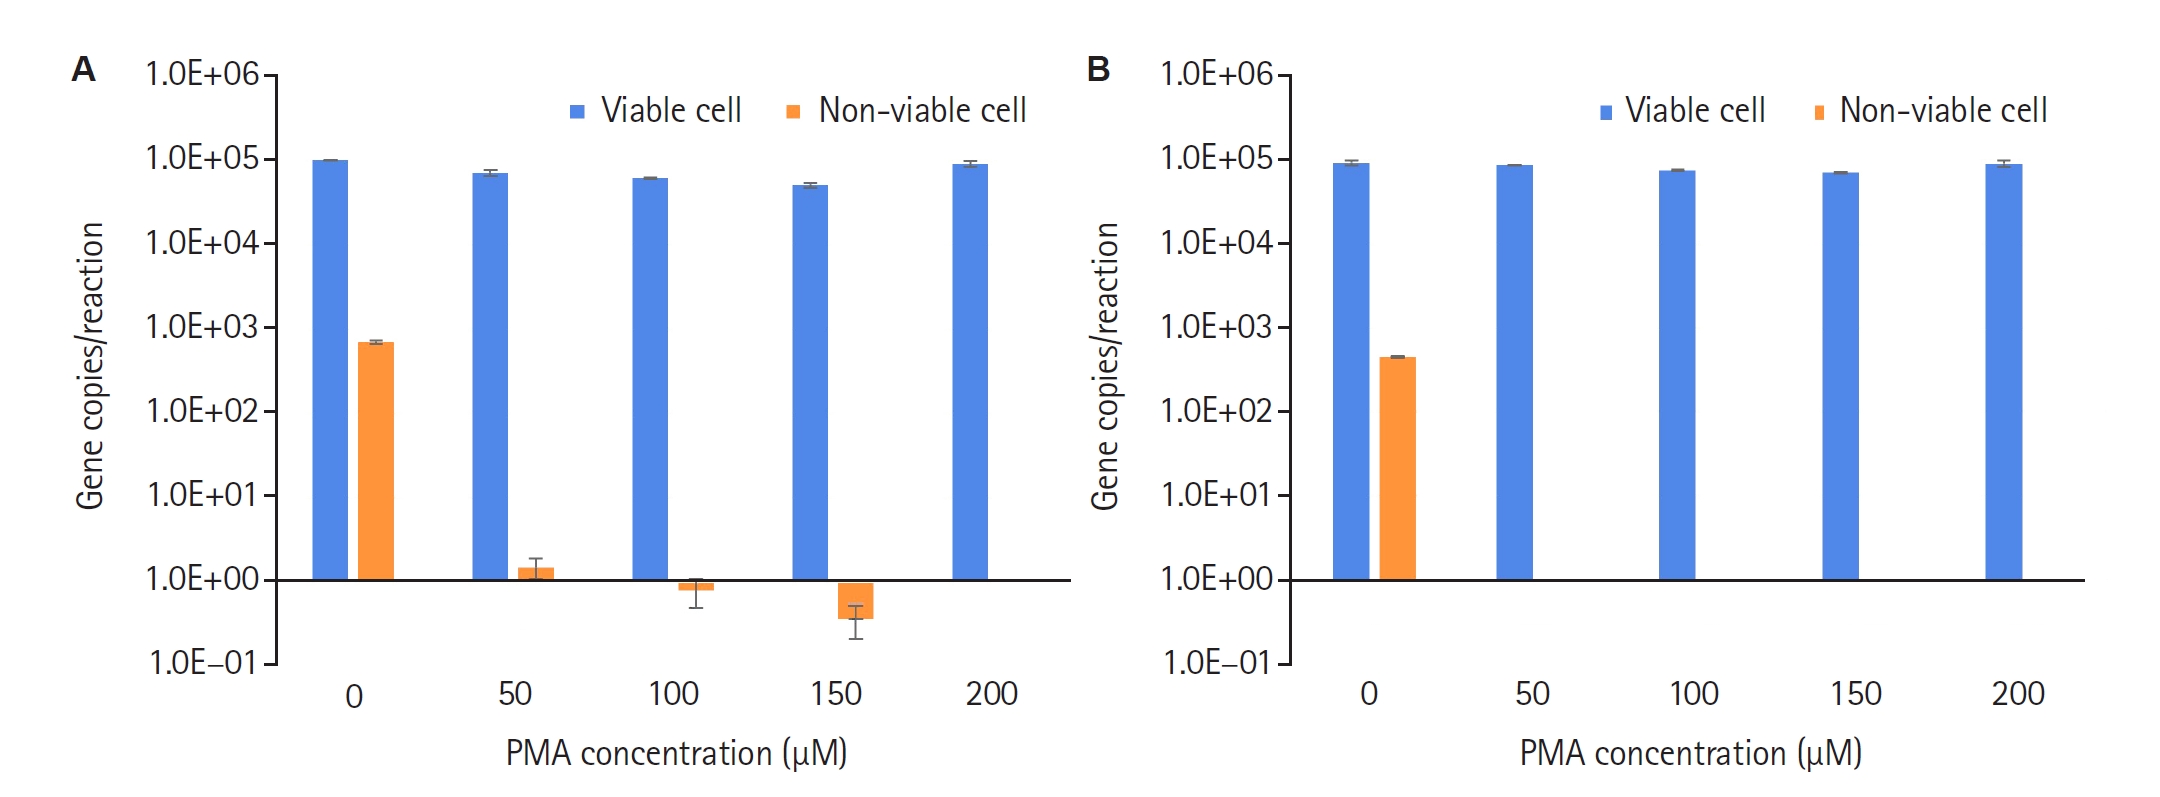
4). First, the influence of amplicon length on PMA-qPCR analysis was assessed using primers generating 180 bp and 420 bp amplicons. With the 180 bp primer, treatment with 50 μM PMA resulted in a copy number difference of more than 4.0 log between viable and non-viable cells; however, complete prevention of amplification from non-viable cells required at least 200 μM PMA (
Fig. 2A). In contrast, the 420 bp primer completely inhibited amplification from non-viable cell at 50 μM PMA (
Fig. 2B). Nevertheless, the PCR efficiency of 420 bp assay (86.2±7.8%) was lower than that of the 180 bp assay (101.7±3.0%) (
Table 2). Therefore, the 180 bp primer set was selected for subsequent analyses because it provided higher PCR efficiency while maintaining effective prevention of amplification from non-viable cells (<1% amplification) following PMA treatment.
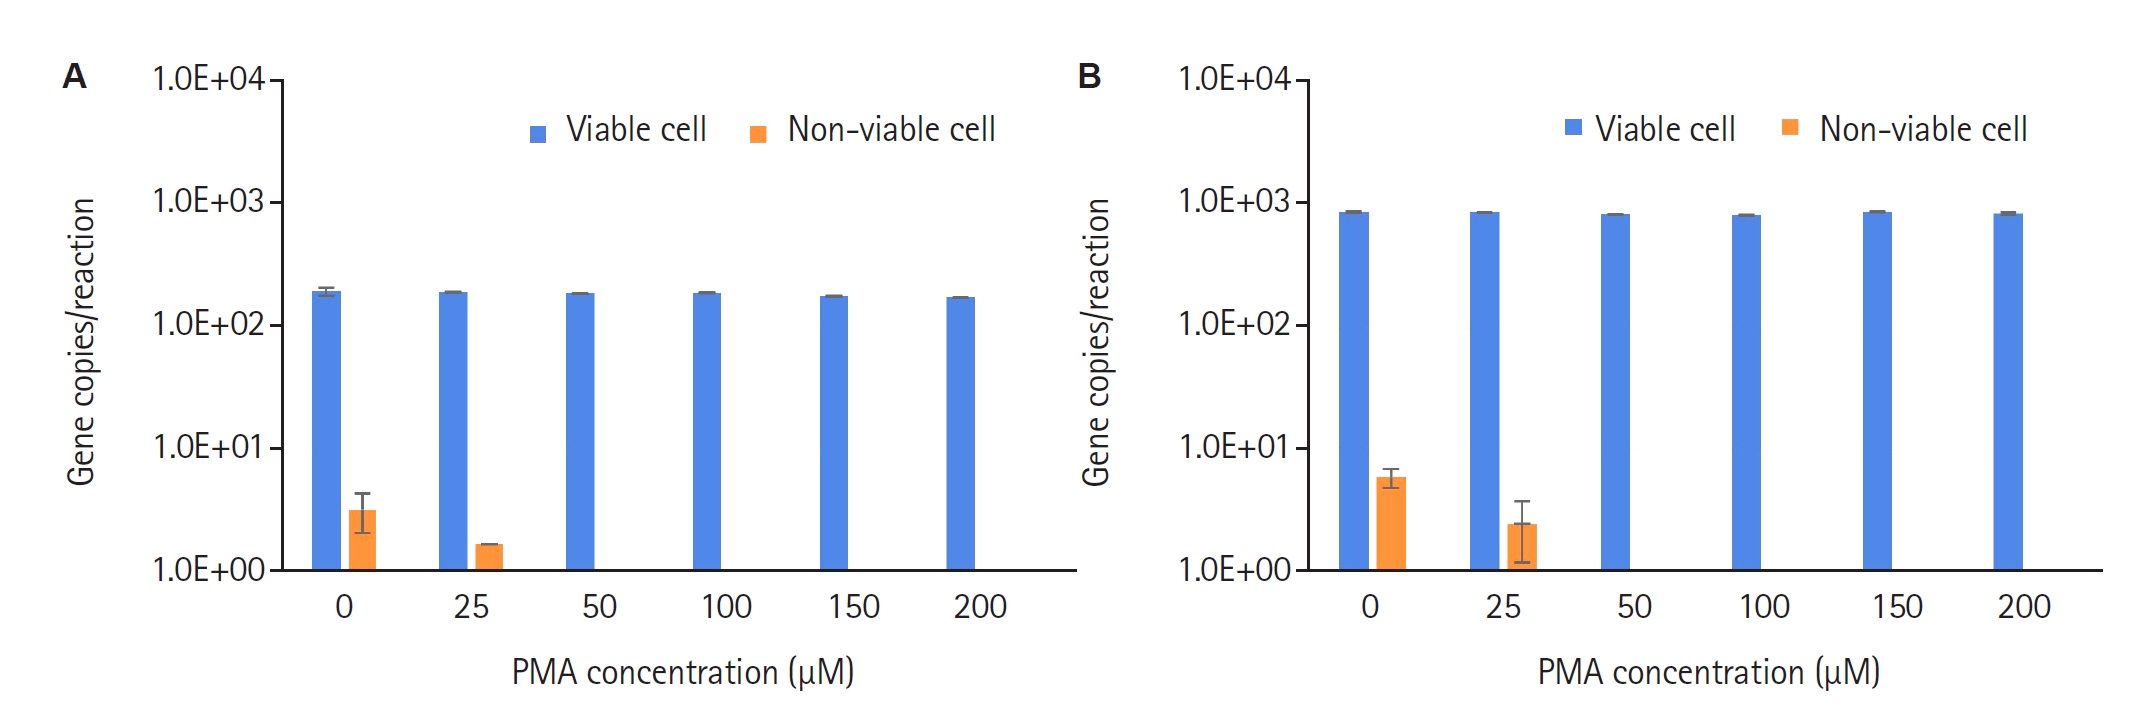
In the absence of PMA treatment, some non-viable trophozoites were detected by qPCR (
Fig. 3A,
B). Treatment with 25 µM PMA reduced the average copy number by 0.3 log compared with the untreated control; however, non-viable trophozoites were not completely excluded. In contrast, no non-viable trophozoites were detected at PMA concentrations of 50 µM or higher. Similarly, non-viable cysts were undetectable following treatment with ≥50 µM PMA. These results demonstrate that PMA effectively penetrates non-viable trophozoites and cysts, thereby inhibiting the amplification of their DNA.
PMA-qPCR analysis revealed that the exclusion efficiency of non-viable cells was dependent on the initial target cell density. At lower cell densities (10²–10³ copies per reaction), non-viable cells were excluded from detection at 50 µM PMA (
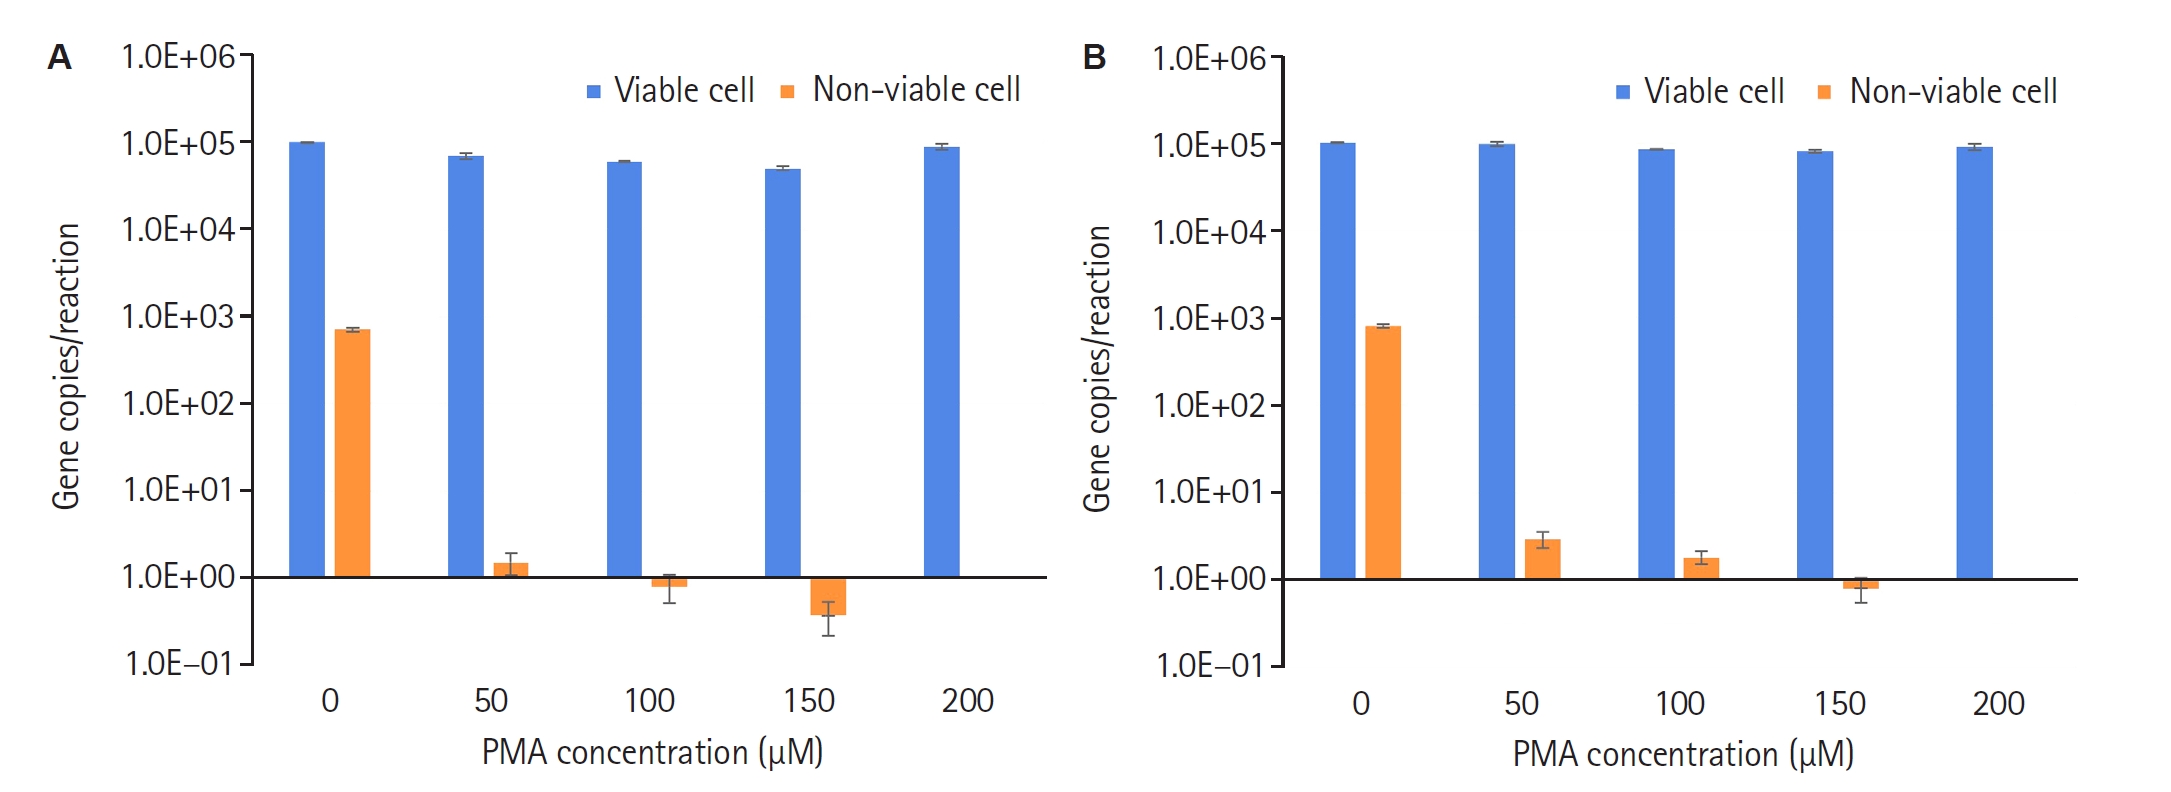
Fig. 3). However, at higher cell densities (10⁴–10⁵ copies per reaction), complete inhibition of non-viable cell detection was achieved only at 200 µM PMA (
Fig. 4A,
B). Comparable results were obtained for both
A. culbertsoni and
A. polyphaga, indicating that the PMA concentration required for the effective exclusion of non-viable cells increases with target cell density.
A total of 72 samples were collected from various treatment processes at water purification plant A. Water quality parameters varied across samples, with turbidity ranging from 0.03 to 28.7 NTU, pH from 6.9 to 8.7, total organic carbon from 0.3 to 3.4 mg/L, and residual chlorine from 0.00 to 0.62 mg/L (
Table 3). Upon applying the PMA-qPCR method to these environmental samples, the spiked positive control was detected in 71 samples. The copy numbers of the detected positive control showed no statistically significant difference compared to the initial spiked amount (
P>0.05). However, the spiked positive control failed to be detected in one raw water sample collected in July. This sample, collected during a period of heavy rainfall, exhibited a turbidity of 28.7 NTU, which was the highest among all analyzed samples; in comparison, the turbidity of the remaining 71 samples ranged from 0.03 to 13.7 NTU.
Consequently, the 71 samples deemed suitable for PMA-qPCR application were analyzed for
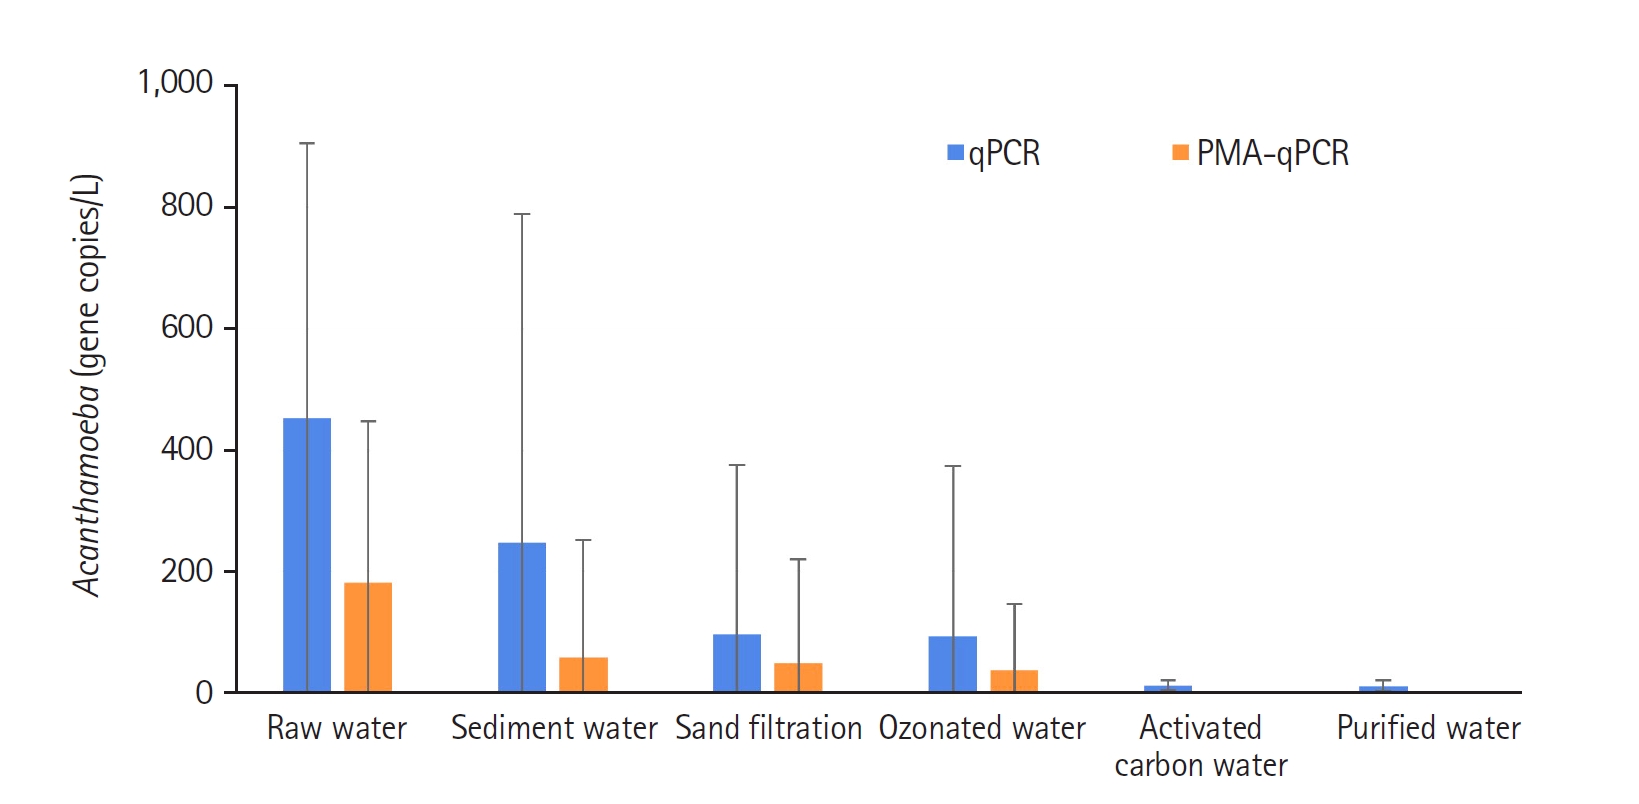
Acanthamoeba. According to the qPCR and PMA-qPCR results for each treatment stage (
Fig. 5), the proportion of viable
Acanthamoeba in raw water was 40.2%, indicating that approximately 60% of the detected population was in a non-viable state. In sedimented water, viable
Acanthamoeba decreased by more than 50% compared to raw water, and no viable
Acanthamoeba were detected in the final purified water (
Fig. 5). Conventional qPCR detected total
Acanthamoeba DNA at an average of 452 copies/L in raw water and 10 copies/L in purified water. In contrast, PMA-qPCR, through the selective amplification of viable
Acanthamoeba, yielded an average of 182 copies/L in raw water. This value further declined during the treatment process, rendering the target undetectable after the activated carbon filtration stage (
Fig. 5).
Discussion
Our results demonstrated that the performance of PMA-qPCR is influenced by both the
Acanthamoeba density and the target amplicon length. When primers and probes targeting a 180 bp amplicon were applied, complete prevention of non-viable cell detection was achieved at a PMA concentration of 200 μM for an initial density of approximately 10⁵ gene copies/reaction (
Fig. 4). Conversely, at lower initial densities (10
2–10
3 gene copies/reaction), non-viable cells were successfully excluded from detection using 50 μM PMA (
Fig. 3). Moreover, when using amplicons longer than 400 bp, prevention of non-viable cell detection was achieved at 50 μM PMA, even at high initial densities (10⁵ gene copies/reaction). Previous studies have typically employed a PMA concentration of 200 μM, likely because they focused on the diagnosis and treatment of
Acanthamoeba-related keratitis, where relatively high densities (≥10⁵ cells/ml) were expected [
16,
17]. In contrast, the present study targeted environmental water samples, in which
Acanthamoeba densities in raw water from the Han River were typically below 10³ gene copies/L (
Fig. 5). Given these relatively low densities, a PMA concentration of 50 μM was selected. Under these conditions, 50 μM PMA was sufficient to prevent the detection of non-viable trophozoites and cysts without affecting the detection of viable
Acanthamoeba.
Furthermore, as the target amplicon size increased, the PMA concentration required to completely eliminate amplification from non-viable cells decreased from 200 to 50 μM. Several studies have reported that longer PCR amplicons are more effective at excluding signals from non-viable cells, likely because the probability of PMA binding to DNA increases with amplicon length [
12,
23-
25]. However, amplicons longer than 400 bp were associated with reduced PCR efficiency. Therefore, selecting an optimal target amplicon size that minimizes amplification from non-viable cells while maintaining high PCR efficiency is crucial for successful PMA-qPCR analysis. Based on these findings, when analyzing samples with high densities of
Acanthamoeba (e.g., clinical keratitis samples or heavily contaminated water), it may be more appropriate not only to increase the PMA concentration but also to design primers and probe targeting amplicons in the range of 200–300 bp.
The PMA-qPCR method successfully detected viable
Acanthamoeba across the 71 environmental samples collected at various stages of the water treatment process, thereby demonstrating its utility as a rapid, culture-independent detection approach. These findings highlight that, due to the presence of non-viable
Acanthamoeba in process water, conventional gene-based qPCR may overestimate microbial densities, whereas PMA-qPCR provides a more accurate assessment by selectively detecting viable cells. As the treatment progressed, the density of viable
Acanthamoeba cells gradually decreased (
Fig. 5). Notably, during the sedimentation stage following coagulation, the number of viable cells decreased by more than 50% on average compared to the raw water, indicating that this process is highly efficient at removing
Acanthamoeba. After the granular activated carbon filtration stage, viable
Acanthamoeba were no longer detected, confirming that the current treatment process is effective in eliminating these pathogenic amoebae. In contrast, samples not treated with PMA showed the presence of non-viable
Acanthamoeba, further reinforcing the high utility of the PMA-qPCR method for viable cell selection.
The PMA-qPCR method was successfully applied to all samples throughout the treatment process; however, it failed for a single raw water sample with a turbidity of 28.7 NTU. This limitation was likely due to the high turbidity caused by heavy rainfall, which introduced suspended solids and other interfering substances into the sample, thereby reducing light transmission and diminishing the efficiency of PMA treatment [
16,
19,
26]. Turbidity can negatively affect PMA activation not only by scattering and absorbing light but also by altering dye availability through interactions with organic matter [
19]. Previous studies have reported that high levels of suspended solids or sludge matrices can substantially reduce the effectiveness of PMA-qPCR, requiring assay optimization to maintain reliable discrimination between viable and non-viable cells [
23,
27]. Based on these results, the PMA-qPCR method is applicable to environmental water samples with turbidity levels of up to 13.7 NTU. For samples exceeding this threshold, further research is needed to improve PMA treatment efficiency. Potential strategies include reducing sample volume, applying pre-dilution to lower turbidity, or exploring alternative light sources with stronger penetration capacity [
19,
26]. However, dilution must be carefully considered, as it may compromise detection in samples with low densities of target microorganisms [
26]. For instance, as observed in our study where the average density of viable
Acanthamoeba was only 182 copies/L, dilution of the sample could increase the risk of false-negative results. The findings of this study were obtained from a single water treatment plant located on the Han River, and conditions may differ in other source waters or treatment plants employing different processes. In addition, non-viable
Acanthamoeba cells used for PMA-qPCR optimization were generated by heat treatment, which provided a practical and reproducible approach for preparing non-viable control cells. However, heat-induced cell damage may differ from that caused by chemical disinfectants commonly used in water treatment processes, such as chlorine and ozone. Future studies incorporating chlorine- or ozone-inactivated
Acanthamoeba cells would help to better reflect real-world water treatment conditions and further validate the applicability of PMA-qPCR for assessing
Acanthamoeba viability in drinking water systems.
In conclusion, the PMA-qPCR method was validated as an effective technique for detecting the viable trophozoites and cysts of pathogenic Acanthamoeba in environmental water. Unlike conventional culture methods, this approach significantly reduces analysis time to a few hours, enabling the rapid detection of viable Acanthamoeba. Therefore, this method can be utilized to evaluate the efficiency of water treatment processes aimed at removing Acanthamoeba and to monitor safety during the water supply distribution. Ultimately, it is expected to contribute to the safe and hygienic management of tap water, ensuring protection against pathogenic microorganisms and thereby mitigating public health risks.
Notes
-
Author contributions
Conceptualization: Lee ES. Investigation: Lee ES, Lee JY. Methodology: Lee ES, Lee JY, Baek YA, Cho SJ. Validation: Lee ES, Baek YA, Cho SJ. Writing - original draft: Lee ES. Writing - review & editing: Lee JY, Baek YA, Cho SJ.
-
Conflict of interest
The authors have no conflicts of interest to declare.
Fig. 1.Sampling points at each stage of water purification plant A.
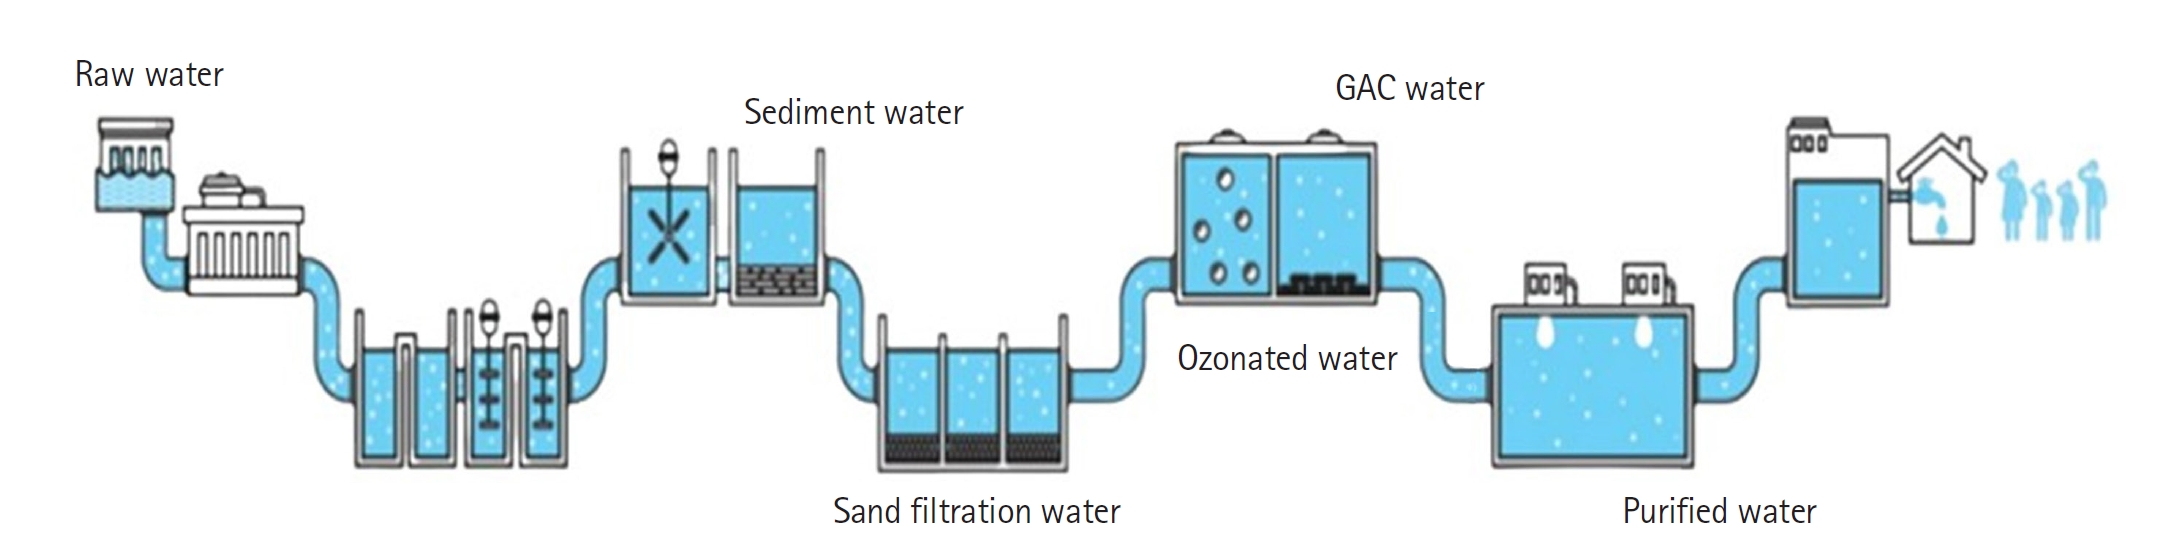
Fig. 2.Effect of amplicon size on the propidium monoazide (PMA) concentration required to inhibit amplification of non-viable Acanthamoeba culbertsoni. (A) 180 bp and (B) 420 bp. Error bars represent standard deviations from 2 independent replicates.
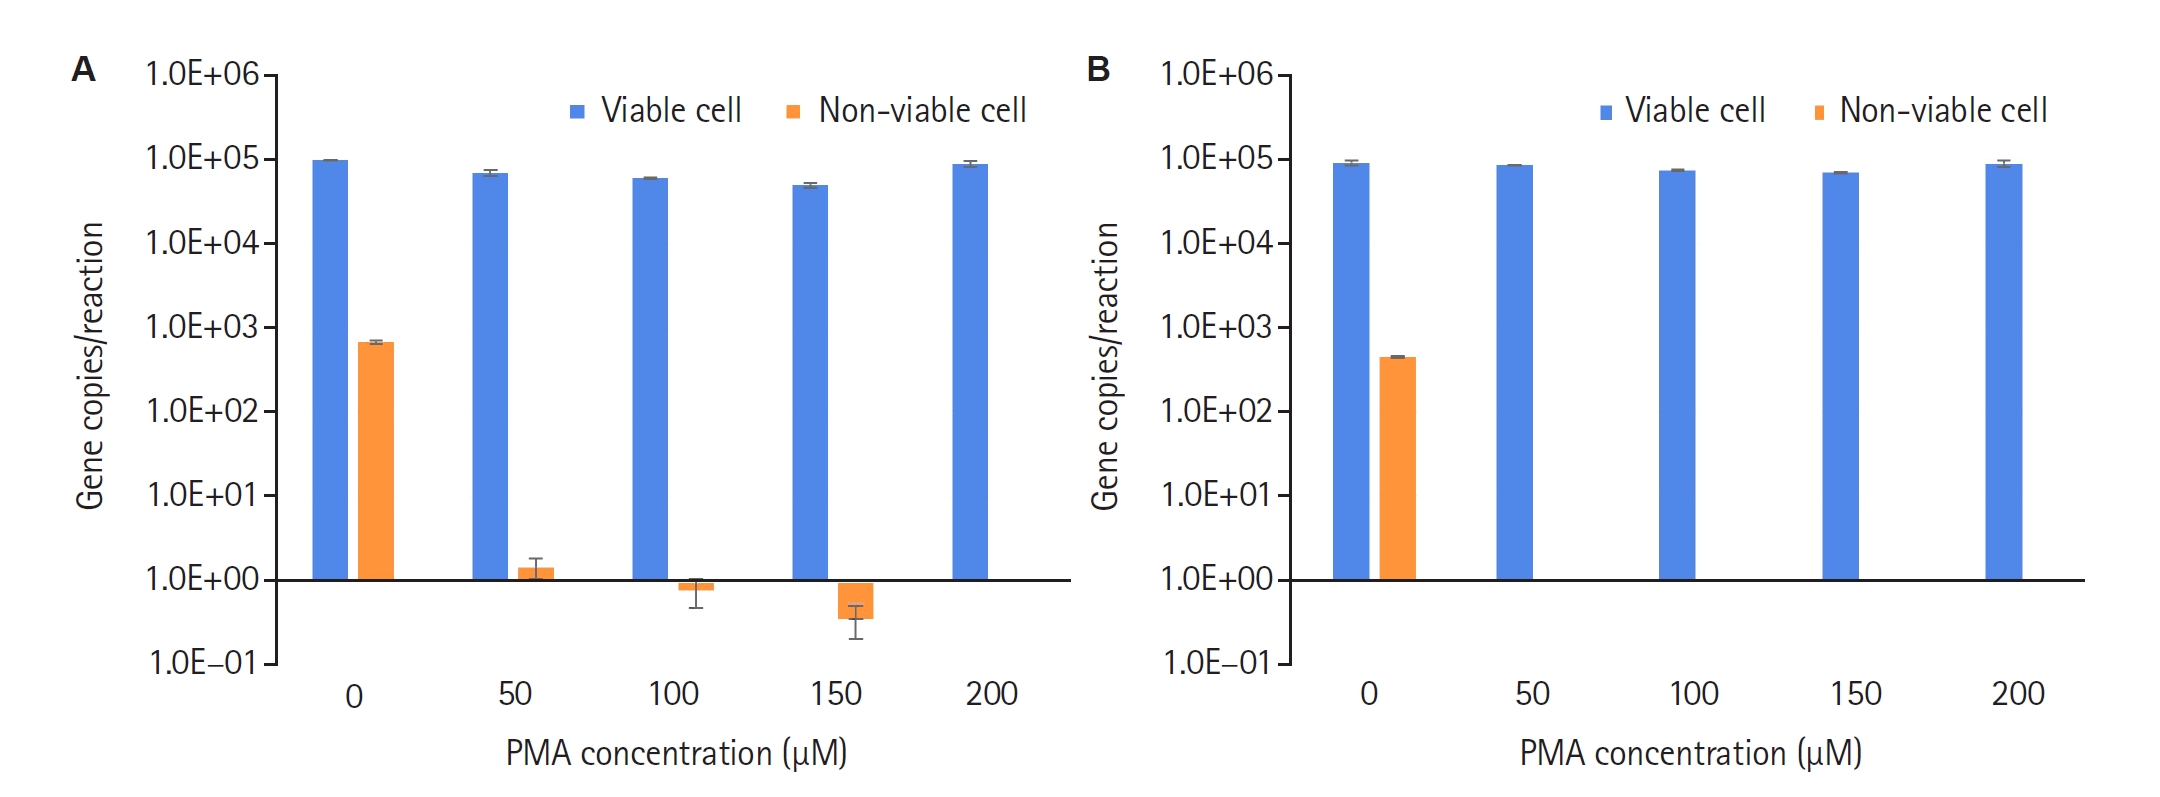
Fig. 3.Effect of propidium monoazide (PMA) concentration on the detection of viable and non-viable Acanthamoeba culbertsoni (A) trophozoites and (B) cysts. Error bars represent standard deviations from 2 independent replicates.
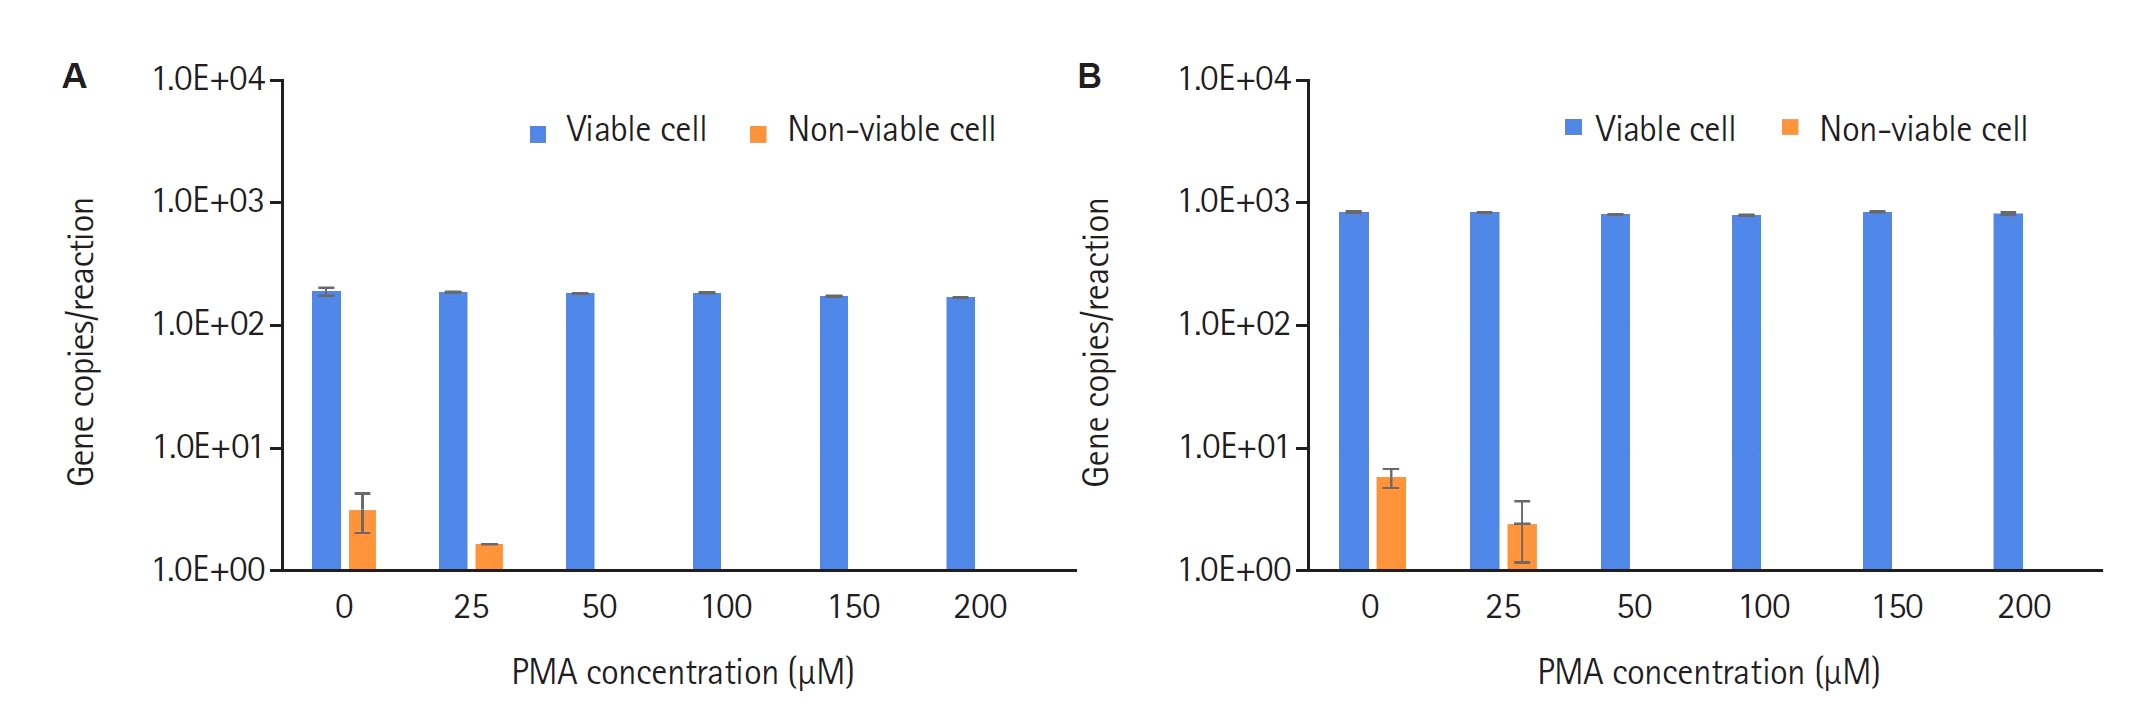
Fig. 4.PMA concentration required for the selective detection of viable Acanthamoeba trophozoites at high target copy numbers (10⁴–10⁵ copies per reaction). (A) A. culbertsoni and (B) A. polyphaga. Error bars represent standard deviations from 2 independent replicates.
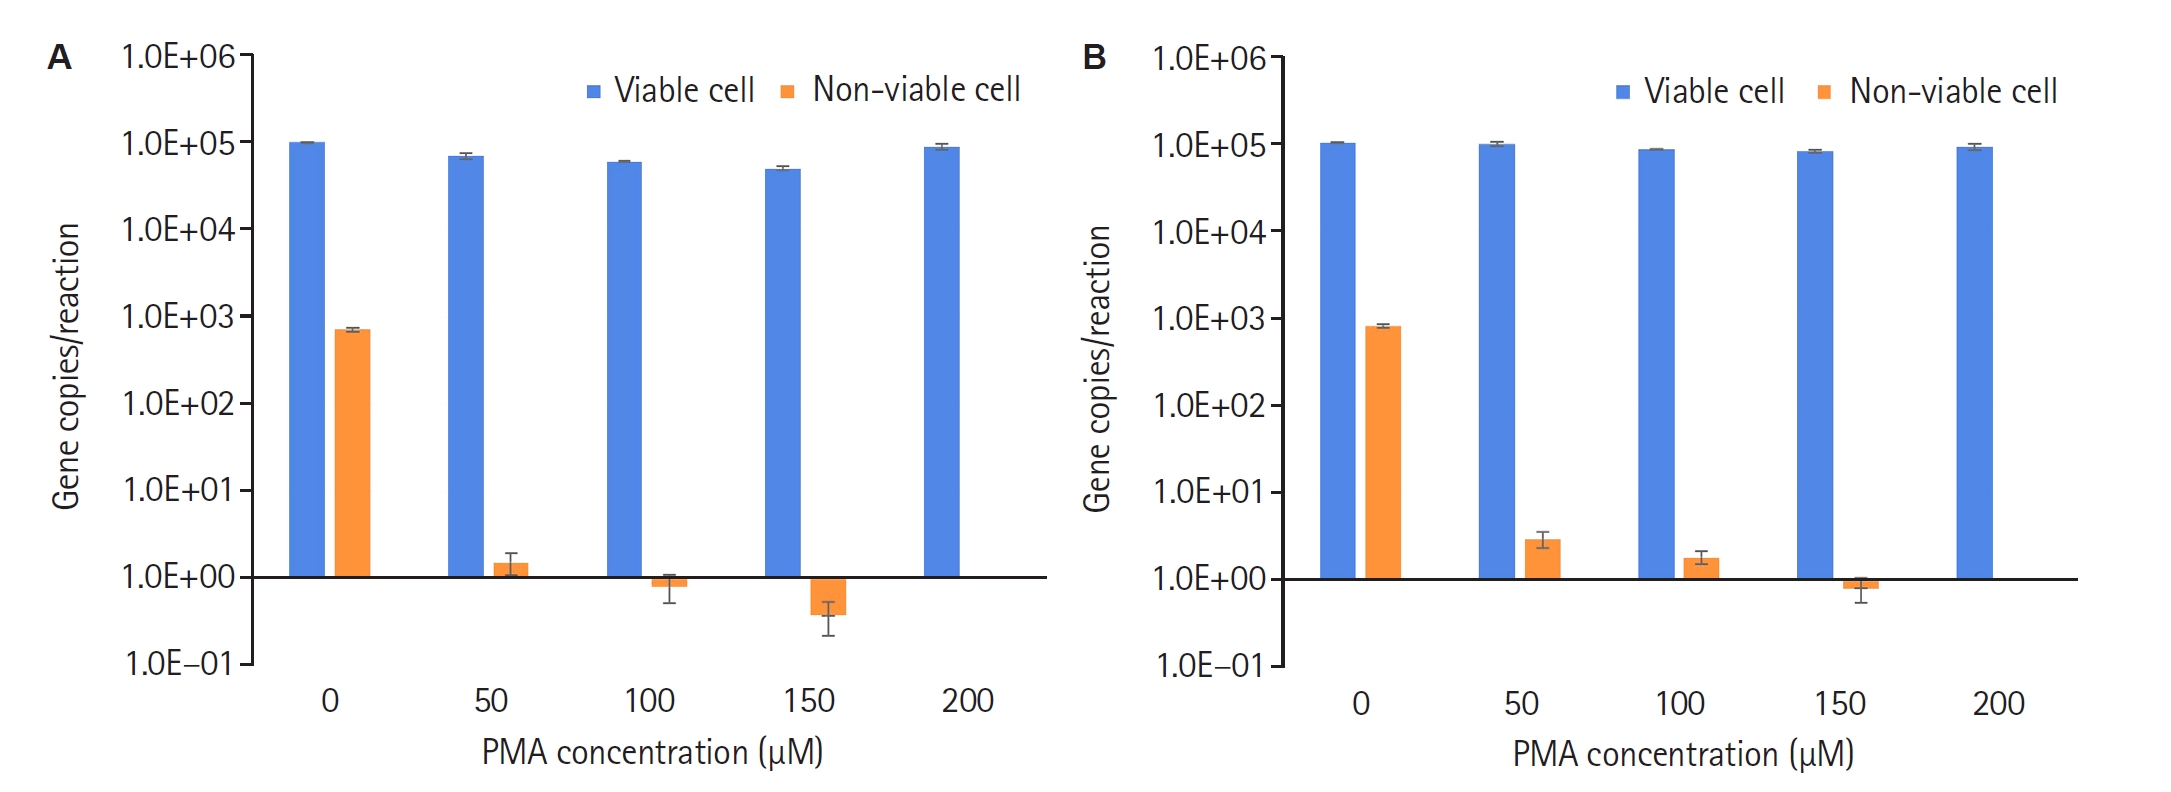
Fig. 5.Distribution of Acanthamoeba DNA across water treatment stages determined by real-time PCR (qPCR) and propidium monoazide (PMA)-qPCR. Error bars indicate standard deviations from 71 environmental samples analyzed in duplicate.
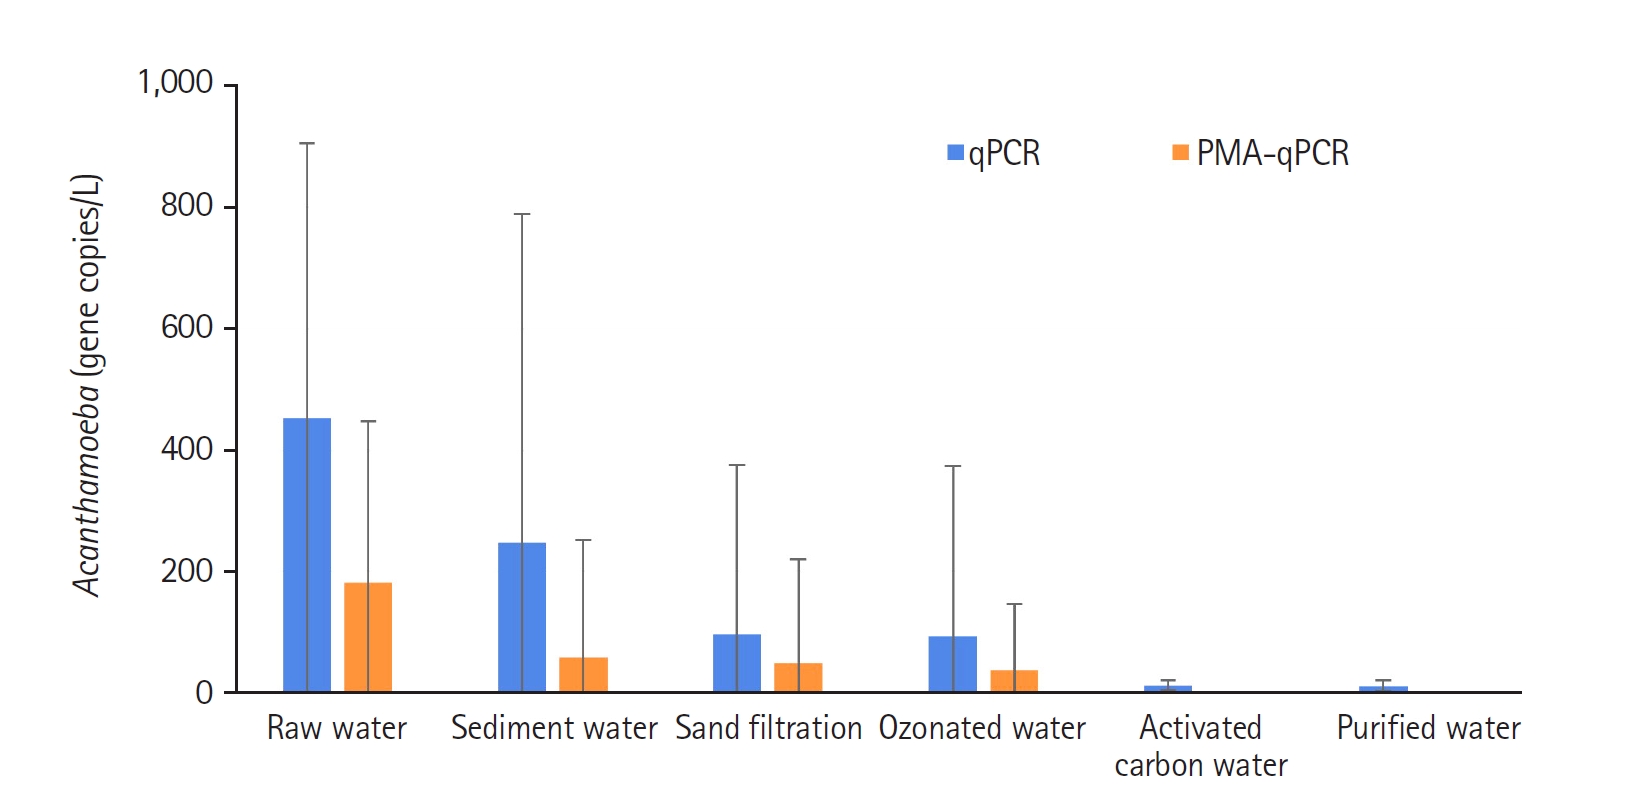
Table 1.Primers and probe used for propidium monoazide–real-time PCR
Table 1.
|
Size (bp) |
Sequence (5’→3’) |
Reference |
|
180 |
F: CCCAGATCGTTTACCGTGAA |
[21] |
|
R: TAAATATTAATGCCCCCAACTATCC |
|
FAM-CTGCCACCGAATACATTAGCATGG-BHQ1 |
|
420–470 |
F: GGCCCAGATCGTTTACCGTGAA |
[22] |
|
R: TCTCACAAGCTGCTAGGGAGTCA |
Table 2.Analytical efficiency of propidium monoazide–real-time PCR using primers with different target sizes
Table 2.
|
Size (bp) |
Efficiency (%) |
|
1a
|
2 |
3 |
Average |
SD |
|
180 |
101.4 |
98.8 |
104.8 |
101.7 |
3.0 |
|
420–470 |
80.7 |
91.7 |
87.3 |
86.2 |
7.8 |
Table 3.Measurement results of water quality parameters in process water at water purification plant A
Table 3.
|
Sample type |
Turbidity (NTU) |
pH |
TOC (mg/L) |
Residual chlorine (mg/L) |
|
Raw water |
7.1 (1.8–28.7) |
7.8 (7.1–8.7) |
2.0 (1.6–3.4) |
- |
|
Sediment water |
0.49 (0.24–0.78) |
7.2 (6.9–7.5) |
1.0 (0.3–1.6) |
0.31 (0.16–0.62) |
|
Sand filtration water |
0.05 (0.03–0.13) |
7.3 (7.0–7.6) |
0.9 (0.3–1.2) |
0.32 (0.12–0.59) |
|
Ozonated water |
0.16 (0.06–0.77) |
7.2 (6.9–7.6) |
0.9 (0.3–1.4) |
0.20 (0.00–0.60) |
|
GAC water |
0.09 (0.04–0.14) |
7.2 (6.9–7.5) |
0.7 (0.3–1.2) |
0.04 (0.01–0.07) |
|
Purified water |
0.05 (0.04–0.09) |
7.1 (6.9–7.3) |
0.6 (0.3–0.8) |
0.52 (0.34–0.62) |
References
- 1. Marciano-Cabral F, Cabral G. Acanthamoeba spp. as agents of disease in humans. Clin Microbiol Rev 2003;16:273-307. https://doi.org/10.1128/cmr.16.2.273-307.2003
- 2. Muchesa P, Mwamba O, Barnar TG, Bartie C. Detection of free-living amoebae using amoebal enrichment in a wastewater treatment plant of Gauteng Province, South Africa. BioMed Res Int 2014;2014:575297. https://doi.org/10.1155/2014/575297
- 3. Dupuy M, Berne F, Herbelin P, et al. Sensitivity of free-living amoeba trophozoites and cysts to water disinfectants. Int J Hyg Environ Health 2014;217:335-9. https://doi.org/10.1016/j.ijheh.2013.07.007
- 4. Loret JF, Greub G. Free-living amoebae: biological by-passes in water treatment. Int J Hyg Environ Health 2010;213:167-75. https://doi.org/10.1016/j.ijheh.2010.03.004
- 5. Horn M, Wagner M. Bacterial endosymbionts of free-living amoebae. J Eukaryot Microbiol 2004;51:509-14. https://doi.org/10.1111/j.1550-7408.2004.tb00278.x
- 6. Pagnier I, Merchat M, La Scola B. Potentially pathogenic amoeba-associated microorganisms in cooling towers and their control. Future Microbiol 2009;4:615-29. https://doi.org/10.2217/fmb.09.25
- 7. Steinert M, Birkness K, White E, Fields B, Quinn F. Mycobacterium avium bacilli grow saprozoically in coculture with Acanthamoeba polyphaga and survive within cyst walls. Appl Environ Microbiol 1998;64:2256-61. https://doi.org/10.1128/AEM.64.6.2256-2261.1998
- 8. Barker J, Brown MR, Collier PJ, Farrell I, Gilbert P. Relationship between Legionella pneumophila and Acanthamoeba polyphaga: physiological status and susceptibility to chemical inactivation. Appl Environ Microbiol 1992;58:2420-5. https://doi.org/10.1128/aem.58.8.2420-2425.1992
- 9. Cirillo JD, Falkow S, Tompkins LS, Bermudez LE. Interaction of Mycobacterium avium with environmental amoebae enhances virulence. Infect Immun 1997;65:3759-67. https://doi.org/10.1128/iai.65.9.3759-3767.1997
- 10. Beattie TK, Seal DV, Tomlinson A, McFadyen AK, Grimason AM. Determination of amoebicidal activities of multipurpose contact lens solutions by using a most probable number enumeration technique. J Clin Microbiol 2003;41:2992-3000. https://doi.org/10.1128/JCM.41.7.2992-3000.2003
- 11. Rivière D, Szczebara FM, Berjeaud J, Frère J, Héchard Y. Development of a real-time PCR assay for quantification of Acanthamoeba trophozoites and cysts. J Microbiol Methods 2006;64:78-83. https://doi.org/10.1016/j.mimet.2005.04.008
- 12. Chang B, Taguri T, Sugiyama K, et al. Comparison of ethidium monoazide and propidium monoazide for the selective detection of viable Legionella cells. Jpn J Infect Dis 2010;63:119-23. https://doi.org/10.7883/yoken.63.119
- 13. Nocker A, Cheung CY, Camper AK. Comparison of propidium monoazide with ethidium monoazide for differentiation of live vs. dead bacteria by selective removal of DNA from dead cells. J Microbiol Methods 2006;67:310-20. https://doi.org/10.1016/j.mimet.2006.04.015
- 14. Nocker A, Mazza A, Masson L, Camper AK, Brousseau R. Selective detection of live bacteria combining propidium monoazide sample treatment with microarray technology. J Microbiol Methods 2009;76:253-61. https://doi.org/10.1016/j.mimet.2008.11.004
- 15. Kralik P, Nocker A, Pavlik I. Mycobacterium avium subsp. paratuberculosis viability determination using F57 quantitative PCR in combination with propidium monoazide treatment. Int J Food Microbiol 2010;141 Suppl 1:S80-6. https://doi.org/10.1016/j.ijfoodmicro.2010.03.018
- 16. Fittipaldi M, Rodriguez NJP, Adrados B, et al. Discrimination of viable Acanthamoeba castellani trophozoites and cysts by propidium monoazide real-time polymerase chain reaction. J Eukaryot Microbiol 2011;58:359-64. https://doi.org/10.1111/j.1550-7408.2011.00557.x
- 17. Veugen JMJ, Savelkoul PHM, Nuijts RMMA, Dickman MM, Wolffs PFG. Enhancing Acanthamoeba diagnostics: rapid detection of viable Acanthamoeba trophozoites and cysts using viability PCR assay. Microbiol Spectr 2025;13:e0181124. https://doi.org/10.1128/spectrum.01811-24
- 18. Visvesvara GS, Balamuth W. Comparative studies on related free-living and pathogenic amebae with special reference to Acanthamoeba. J Protozool 1975;22:245-56. https://doi.org/10.1111/j.1550-7408.1975.tb05860.x
- 19. Fittipaldi M, Nocker A, Codony F. Progress in understanding preferential detection of live cells using viability dyes in combination with DNA amplification. J Microbiol Methods 2012;91:276-89. https://doi.org/10.1016/j.mimet.2012.08.007
- 20. Ministry of Environment. Korean standard method for the examination of water. Ministry of Environment; 2013.
- 21. Quarnstrom Y, Visvesvara GS, Sriram R, da Silva AJ. Multiplex real-time PCR assay for simultaneous detection of Acanthamoeba spp., Balamuthia mandrillaris, and Naegleria fowleri. J Clin Microbiol 2006;44:3589-95. https://doi.org/10.1128/jcm.00875-06
- 22. Schroeder JM, Booton GC, Hay J, et al. Use of subgenic 18S ribosomal DNA PCR and sequencing for genus and genotype identification of Acanthamoebae from humans with keratitis and from sewage sludge. J Clin Microbiol 2001;39:1903-11. https://doi.org/10.1128/jcm.39.5.1903-1911.2001
- 23. Luo JF, Lin WT, Guo Y. Method to detect only viable cells in microbial ecology. Appl Microbiol Biotechnol 2010;86:377-84. https://doi.org/10.1007/s00253-009-2373-1
- 24. Contreras PJ, Urrutia H, Sossa K, Nocker A. Effect of PCR amplicon length on suppressing signals from membrane-compromised cells by propidium monoazide treatment. J Microbiol Methods 2011;87:89-95. https://doi.org/10.1016/j.mimet.2011.07.016
- 25. Soejima T, Iida K, Qin T, et al. Method to detect only live bacteria during PCR amplification. J Clin Microbiol 2008;46:2305-13. https://doi.org/10.1128/jcm.02171-07
- 26. Yuan Y, Zheng G, Lin M, Mustapha A. Detection of viable Escherichia coli in environmental water using combined propidium monoazide staining and quantitative PCR. Water Res 2018;145:398-407. https://doi.org/10.1016/j.watres.2018.08.044
- 27. Bae S, Wuertz S. Discrimination of viable and dead fecal Bacteroidales bacteria by quantitative PCR with propidium monoazide. Appl Environ Microbiol 2009;75:2940-4. https://doi.org/10.1128/AEM.01333-08