Abstract
Human hydatid disease (cystic echinococcosis, CE) is a chronic parasitic infection caused by the larval stage of the cestode Echinococcus granulosus. As the disease mainly affects the liver, approximately 70% of all identified CE cases are detected in this organ. Optical molecular imaging (OMI), a noninvasive imaging technique, has never been used in vivo with the specific molecular markers of CE. Thus, we aimed to construct an in vivo fluorescent imaging mouse model of CE to locate and quantify the presence of the parasites within the liver noninvasively. Drug-treated protoscolices were monitored after marking by JC-1 dye in in vitro and in vivo studies. This work describes for the first time the successful construction of an in vivo model of E. granulosus in a small living experimental animal to achieve dynamic monitoring and observation of multiple time points of the infection course. Using this model, we quantified and analyzed labeled protoscolices based on the intensities of their red and green fluorescence. Interestingly, the ratio of red to green fluorescence intensity not only revealed the location of protoscolices but also determined the viability of the parasites in vivo and in vivo tests. The noninvasive imaging model proposed in this work will be further studied for long-term detection and observation and may potentially be widely utilized in susceptibility testing and therapeutic effect evaluation.
-
Key words: Echinococcus granulosus, protoscolex, fluorescent imaging, in vivo, noninvasive, mouse model
INTRODUCTION
Human cystic echinococcosis (CE) is a major cause of zoonotic diseases of public health and economic significance. Wild animals, such as dogs and foxes, are the main sources of CE infection. Dogs ingest the organs of an intermediate host containing hydatid cysts with protoscolices. Humans are infected by contact with dogs or ingestion of eggs from contaminated water, vegetables, or other types of foods [
1]. Infection with
Echinococcus granulosus causes development of 1 or several unilocular hydatid cysts, which, in humans, usually develop mainly in the liver (70%), lungs (20%), and other parts of the body (brain and body musculature, 10%). The parasite has a wide geographical distribution, and despite significant efforts to control, it remains as an intractable problem for animal health and livestock economy [
2,
3]. CE is mainly prevalent in humans and animal hosts in several parts of Eurasia, including the Mediterranean regions, southern and central parts of Russia, central Asia, and midwest China, Australia, parts of America (especially South America), and northeast Africa [
4-
6].
Four major treatment approaches are used to control EC: (1) surgery, (2) PAIR, which involves puncture (P), aspiration (A), and injection of a parasiticidal agent (I), (3) chemotherapy with albendazole (ABZ) or mebendazole, and (4) monitoring of inactive cysts [
7-
9]. Surgery is considered the most effective method to achieve complete cure but often accompanied by high risks of recurrence. Drug therapy exerts certain effects on hepatic echinococcosis, but the effectiveness and toxicity of drug, as well as the stimulation brought about by long-term medication to the liver and kidneys, must be considered. Further research and development of new drugs plays an important role in achieving complete CE treatment [
10,
11]. Traditional assays for monitoring infection in animal models are based on the evaluation of parasite loads in target organs by anatomopathological observations, such as microscopic examination of lesions. However, these techniques are cumbersome, laborious, and rendered difficult by the longitudinal monitoring of an infection in the same animal, which is necessary to achieve dynamic monitoring and observation of multiple time points of the infection courses. Consequently, the construction of a living experimental model of
E. granulosus is required.
Metformin (Met), a drug commonly prescribed as a first-line treatment for type 2 diabetes (T2DM), has recently gained renewed interest because of its potential antitumorigenic effects. Recent studies indicate that the drug may potentially function as a chemotherapy adjuvant. Research shows that these features may be attributed to several imprecise mechanisms; thus, the potential of Met to inhibit growth of cancer cells in vitro and vivo has been suggested [
12]. The results of numerous retrospective studies have repeatedly shown that T2DM patients receiving Met present decreased risks of developing various types of cancers (e.g., breast and ovarian cancers) and better responses to chemotherapy compared with those taking other hypoglycemic drugs [
13]. In this work, we studied the susceptibility of
E. granulosus larvae to Met in vitro.
Optical molecular imaging (OMI) is a rapidly developing biomedical research discipline that allows the visual representation, characterization, and quantification of biological processes at the microscopic and macroscopic level within intact living organisms; the technique was developed based on genomics, proteomics, and modern optical imaging techniques through qualitative or quantitative observations and research of the activities of molecules and cells in physiological and pathological processes in vivo using specific molecular markers (e.g., luciferase and fluorescent protein) [
14,
15]. OMI is increasingly being utilized in disease diagnosis and therapeutic effect evaluation, and some research achievements have been obtained in preclinical studies [
16]. The technique has gained popularity over the past decade because of its easy translation from in vitro to in vivo experiments, high sensitivity, and applicability to the fields of cancer, stem cells, and infectious diseases [
14]. However, extensive research of an in vivo living imaging model of
E. granulosus has not yet been performed. In this work, we constructed an in vivo CE fluorescent imaging mouse model that can determine not only the intensity of signals from parasites and distribution of reporter molecules but also the relationship between fluorescence intensity and protoscolex activity. We also discussed the prospective use of mouse models in establishing long-term in vivo bioluminescence models and drug sensitivity testing of
E. granulosus.
MATERIALS AND METHODS
Ethics statement
All animal experiments were approved by the Institutional Animal Care and Use Committee of Shihezi University, Iran.
Animals
Pathogen-free CF-1 male mice (28-35 g) aged 6-8 weeks were obtained from Xinjiang Medical University (Urumqi, China). Groups of 4 mice were housed in a standard polyethylene cage covered with sawdust (wooden powder) as nesting material under controlled laboratory conditions (temperature±20˚C, 12 hr light/12 hr dark cycle with lights off at 8:00 p.m., 55±5% humidity). Each cage was cleaned every 5 days and replaced with fresh sawdust. Water and food pellets were provided ad libitum throughout experiment. Each mouse was subjected to fasting for 24 hr before the experiment.
In vitro culture of protoscolices and treatment with metformin and albendazole
E. granulosus protoscolices were extracted under aseptic conditions from the hydatid cysts of infected livers of sheep presented for routine slaughter at the abattoir in Xinjiang Province, Changji. The protoscolices were sterile cultured (37˚C, 5% CO2) in medium (10% fetal calf serum) after thorough cleaning. Albendazole (ABZ) was purchased from Zhejiang Chemical Import and Export Co., China, and Met was purchased from Sigma-Aldrich (St. Louis, Missouri, USA). Both drugs were added to the culture medium containing 10% fetal calf serum (Sigma-Aldrich) and RPMI 1640 culture medium (Sigma-Aldrich) separately or in combination. In vitro protoscolex treatment was assayed with 10 mM Met or the combination of 10 mM Met+15 µM ABZ (equivalent to 4.2 µg/ml) for 5 days. In both cases, the viability of protoscolices was assessed daily by eosin staining and observation under an inverted light microscope. Each viability test was performed using 3 replicates for each treatment condition and repeated 3 times.
JC-1 dye was supplied by Life Technologies (Grand Island, New York, USA); the dye was applied as a mitochondrial ΔCm indicator to test changes in ΔCm during protoscolex apoptosis. The ratio of red to green fluorescence intensity was determined to evaluate changes in the mitochondrial membrane potential and viability of protoscolices.
In vitro protoscolex imaging and fluorescence gradient assays
Control and drug-treated (including Met-treated and combined-medication groups) protoscolices were cultured 48 hr after addition of drugs. The 3 groups of protoscolices were transferred into 24-well plates (5,000 cells/well) and washed 3 times with PBS buffer at room temperature before staining. Then, 100 µl of JC-1 (10 µg/ml) was added to each well, and the plate was vibrated for 3 min in the dark. The reaction mixture was wrapped with aluminum foil and incubated for 30 min with gentle mixing at 37˚C. After staining, the parasites were washed thrice with 20 mM HEPES buffer (pH 7.2) and transferred to 35 mm laser confocal culture dishes (1,000 cells/dish). Images were captured by a confocal microscope (Nikon Eclipse C1 Plus). The intensities of green and red fluorescence in 10 individual protoscolices from the control and treated samples were analyzed, and images were processed using Image J software (NIH). The ratio of red to green fluorescence in the protoscolex images was calculated using NIH Image J software.
To evaluate gradient changes in the fluorescent signals, each group of labeled protoscolices was counted and subjected to fluorescent imaging in a 24-well black culture dish with the corresponding drug concentration using an IVIS system under 514 nm excitation and 529 nm emission for green fluorescence and 585 nm excitation and 590 nm emission for red fluorescence. The parasites were continuously cultured and imaged every 12 hr after the first imaging under the same imaging conditions. The intensity of the region of interest (ROI) was plotted in units of maximum number of photons per second per square centimeter per steridian (p/s/cm2/sr). The tendency of fluorescence intensity signals was also plotted.
Construction of fluorescent E. granulosus mouse models
To reduce the occurrence of autofluorescence from the animals at higher wavelengths, mice were pretreated with depilatories (Mayllie, CP WAX Co., Italy) to molt hair from their chest and abdomen and subjected to 24 hr fasting before in vivo assays. Under anesthesia with 5% chloral hydrate, the mouse abdomen was disinfected with iodophor (1%), and surgery was carried out using aseptic ophthalmic instruments to cut off the skin and muscle layers until the liver was exposed. The 3 groups of protoscolices (3,000 cells) were injected into the Glisson’s capsule, and the incision was sutured. In the control group, the CE mice (n=3) were injected with untreated protoscolices. All of the operations above were performed under sterile conditions. The injected mice were monitored using the IVIS system every 12 hr post-injection to obtain longitudinal fluorescence images. ROIs included green (excitation/emission wavelength=485 nm/538 nm) and red (excitation/emission wavelength=485 nm/590 nm) fluorescence. Each of the model mice was continuously housed in polyethylene cages in warm conditions (temperature±35˚C) and all other conditions described above maintained. In vitro fluorescence gradient assays were performed with the control group. ROIs were drawn over the signals, and average radiant efficiency was quantified in terms of p/s/cm2/sr.
Statistical analysis
All data are presented as the mean±SD of more than 3 independent measurements. Significant differences were determined using the Student’s t-test (SPSS version 19, IBM, Chicago, Illinois, USA), and differences were considered statistically significant when P<0.05.
RESULTS
Metformin and its combination with albendazole affected the sensitivity of E. granulosus protoscolices
To confirm the specificity of the in vitro sensitivity of Met on the viability of
E. granulosus, the death percentage of protoscolices in response to various drug treatments was analyzed.
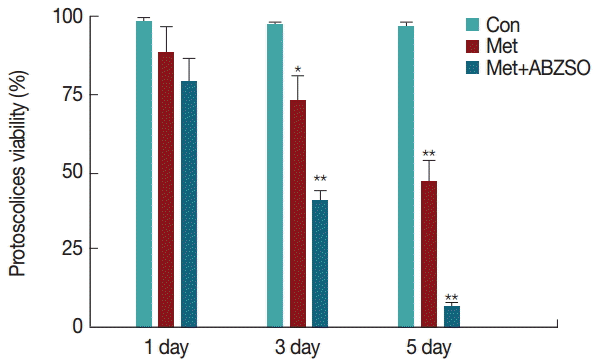
Fig. 1 shows the protoscolices divided into 3 groups. The viability of Met-treated protoscolices decreased over time, and 50±5% of the protoscolices were dead after 5 days of incubation. A significant increase in anti-echinococcal effects was observed when the combination of Met+ABZ was used to treat the protoscolices. In this case, protoscolex mortality increased to over 90% after 5 days of incubation with 10 mM Met+15 mM ABZ. Untreated protoscolices remained at least 95±5% viable throughout the experiment.
To explore the possible inhibitory effects of Met on the protoscolices, we used the ΔCm indicator JC-1 to monitor the status of apoptosis in
E. granulosus protoscolices. JC-1, a charged fluorescent compound, can penetrate mitochondria and change its original color when ΔCm is altered. In normal mitochondria with high ΔCm, JC-1 accumulates as aggregates with intense red fluorescence; in damaged mitochondria with low ΔCm, it maintains its monomeric form, which exhibits only green fluorescence. Fluorescence images of the control and drug-treated protoscolices were examined by confocal microscopy, and the mitochondrial ΔCm was determined following 48 hr of Met treatment. The intensity of red fluorescence in comparison with green signals revealed no significant difference under magnification, and the relative values of red/green fluorescence ratios showed low-level dispersion with a mean ratio of around 1.2 (
Fig. 2B,
D). Untreated protoscolices emitted stronger red fluorescence than green fluorescence and revealed a high ratio of red to green fluorescence with a mean value of 4.4 (
Fig. 2A,
D). The combined-medication group showed an increase in depolarized regions, as indicated by the disappearance of red fluorescence and increase in green fluorescence; in this group, the ratio of red to green fluorescence showed a mean value of 0.6 (
Fig. 2C,
E).
We assessed and compared the attenuation tendency of fluorescence intensity after the protoscolices were labeled with JC-1. In this experiment, protoscolices (5×10
3) were resuspended and added to 24-well plates, after which fluorescence imaging was performed at 0, 12, 24, 36, and 48 hr. Drug-treated and control groups were monitored to quantify the fluorescence intensity and viability of protoscolices. Red fluorescent signals decreased over time in the 3 groups; however, the combined-medication group showed a marked downward trend of signal intensity, followed by the Met-treated group (
Fig. 3A). Compared with the control, the red fluorescence intensities of the 2 drug-treated groups showed obvious statistically significant differences in the fluorescence gradient assays. Over the entire course of detection, the green fluorescent signals showed an obvious rising trend that subsequently declined gradually after 36 hr in the 2 drug-treated groups; by contrast, the control group showed a consistent downward trend (
Fig. 3B). Statistical analysis results yielded obvious significant differences.
We assessed whether stained protoscolices could be noninvasively located and quantified in the liver of mice at different time points. To determine the feasibility of detecting protoscolex activity after drug treatment, experiments were carried out using a fluorescence imaging system (IVIS Spectrum). Drugtreated protoscolices were injected into the Glisson’s capsule of the mice in 2 test groups. In the control group, model mice were injected with untreated protoscolices. The distribution of protoscolices in the liver was monitored at the supine position every 12 hr post-injection until the fluorescence signals gradually disappeared, and ROIs were tracked retrospectively around the liver area to quantify the fluorescence intensity of the infected region. Fluorescence signals were clearly detected in the infected region of the control group (
Fig. 4A). Besides stronger red fluorescence in comparison with green fluorescence, the mouse model also showed larger fluorescence regions and higher ROIs. The ratio of red to green fluorescence showed a mean value of 4.1 (
Fig. 4D). No significant differences in intensities of red and green fluorescence were observed in the Met-treated group over the course of monitoring (
Fig. 4B). The mean fluorescence ratio of the Met-treated group was around 1.2 (
Fig. 4D). In the combined-medication group, the 2 fluorescence reactions were clearly differentiated in terms of intensity and real-time ROI values (
Fig. 4C). The red fluorescence signal of the injection region was clearly lower than its green fluorescence signal, and the red/green fluorescence ratio showed a low value of 0.5 (
Fig. 4E).
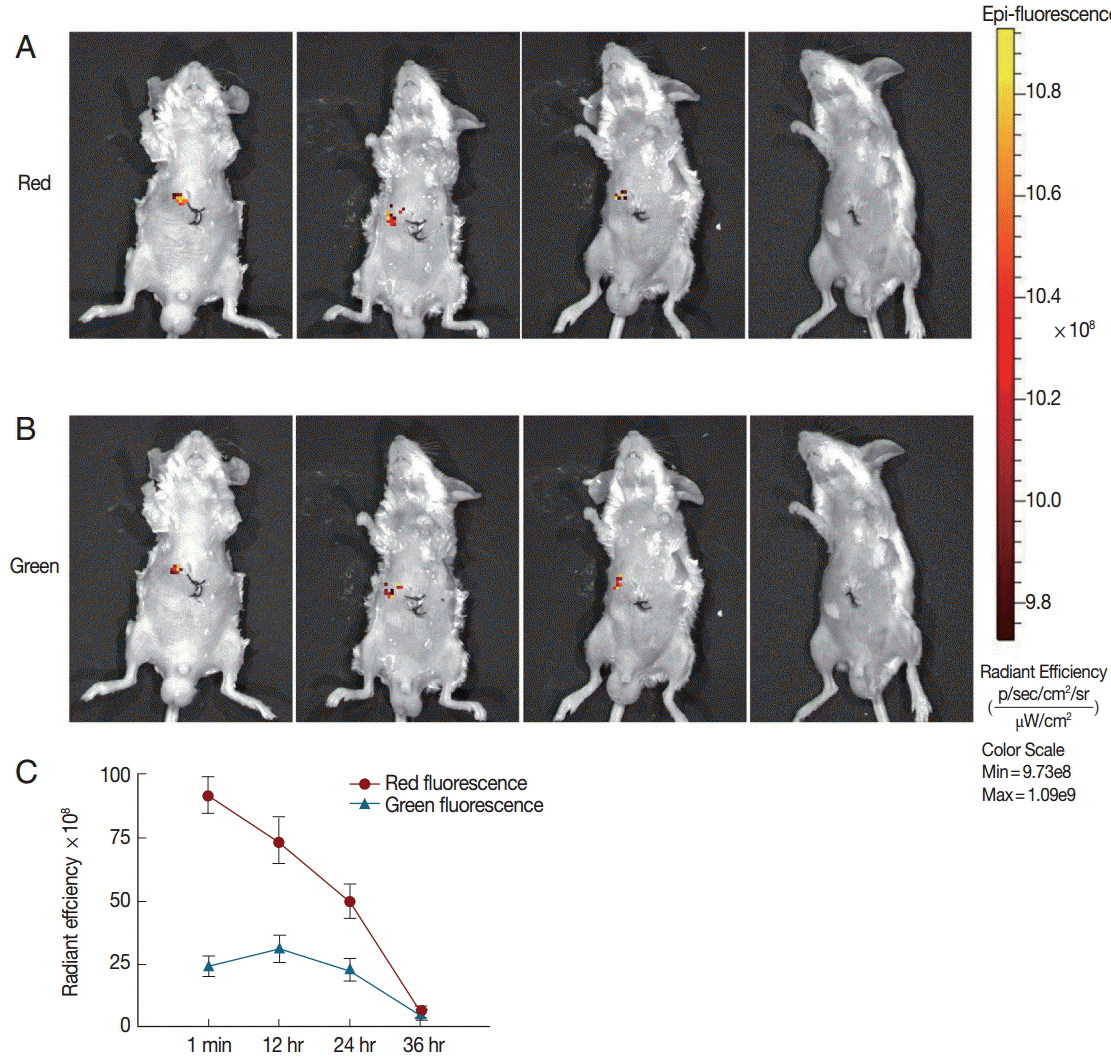
To track the tendency of fluorescence intensity in the mice, the control group was subjected to gradient assays of the red and green fluorescence of JC-1-labeled protoscolices. The distribution of fluorescence signals in the mice was captured every 12 hr in supine position until the signals had completely disappeared. After monitoring for 36 hr, the red fluorescence faded gradually until total regression (
Fig. 5A). By contrast, the green fluorescence showed a brief increase in intensity and then gradually vanished (
Fig. 5B). Both red and green fluorescence signals completely disappeared after 36 hr (
Fig. 5C).
DISCUSSION
E. granulosus, an important and widespread zoonotic, continues to be an important health problem and substantial cause of morbidity and mortality in many parts of the world. Taking into account the lack of a platform that can support dynamic and longitudinal monitoring research, we report here, for first time, the construction of an in vivo fluorescent imaging of E. granulosus in mouse models.
Met is the first-line medication for T2DM. Results from several clinical studies show that T2DM patients treated with Met present lower cancer risks, including hepatoma [
17]. Considering the similarities between hepatic cancer and echinococcosis growth, several studies of liver hydatids were based on models of hepatic cancer. Therefore, the ability of Met to interfere with the energy-generating systems of parasites was harnessed to achieve anti-echinococcal effects, which is a reasonable approach to fight parasitic infections. The potential mechanisms of action of Met in anti-echinococcals may focus on their effects on important signaling pathways. Met inhibits complex I of the intracellular mitochondrial electron transport chain, leading to a decrease in energy charge and inducing 5ʹ-AMPactivated protein kinase (AMPK) activation [
18]. AMPK improves the translocation of glucose transporters and inhibits raptor, a positive regulator of the rapamycin target in TOR complex 1 (TORC1) [
19].
Several studies use a variety of dyes, including eosin and trypan blue [
20], for hydatid staining. Immunofluorescence is also used in similar contexts to stain parasites and allow observation of the microstructure of
E. granulosus protoscolices. However, approaches to verify apoptosis in parasites at time points besides the 2 states of survival and death via a short and simple test have yet to be developed. JC-1 dye, as a fluorescent probe for monitoring mitochondrial ΔCm are frequently used to assess mitochondrial functions, particularly those of myocytes and neurons, in intact tissues and isolated mitochondria [
21,
22]. In this work, JC-1 was used to monitor the viability of protoscolices and the state of apoptosis because this dye has been used in a very large number of published studies. We tested the pharmacological effects of Met and the combination of Met and ABZ on
E. granulosus larvae in in vivo and in vitro assays to determine the anti-echinococcal effects of the drugs in terms of the relative values of red/green fluorescence. In short-term assays, Met showed anti-echinococcal effects on parasites maintained in a nutrient-replete medium, inhibiting complex I of the mitochondrial electron transport chain and subsequently inducing a decrease in the cell energy charge [
23]. These changes may explain the change in ratio of red to green fluorescence observed in this work. An increase in pharmacological action after combination of Met with ABZ, a traditional antiparasitic agents [
24], indicates inhibition of aggregation in the cytoplasmic microtubule system of the parasites, which blocks the uptake of a variety of nutrients and glucose, after crossing the tegumental system and to achieve the tissue distribution.
Whether the fluorescent signal of protoscolices could be detected in vivo should be determined in a mouse model. Thus, the fluorescent signals were captured at different time points. Compared with the normal attenuation shown by the control, significant decreases in red fluorescence were observed in cells incubated with Met and the combined drug, likely because the parasites were significantly impaired by the drugs (
Fig. 3A). The intensity of green fluorescence also showed an obvious upward trend in the drug-treated groups (
Fig. 3B), both of double mark reveal statistical significance compared with the control (
Fig. 3A,
B).
Sterile laparotomy was carried out in each model, and the labeled protoscolices were injected into the Glisson capsule, the main portion of the liver infected by the parasite, until a transparent vacuole was formed. We detected fluorescence signals in the infected area under the condition of background separation in the mouse models, and some of the fluorescence signals were fairly strong and adequate to support quantitative analysis. We thus speculate that different signals may also be detected under different treatments of the protoscolices. This hypothesis is supported by our data showing that the intensity and region size of the red and green fluorescence signals showed no significant differences in Met-treated in the same mice compared with those of control samples (
Fig. 4B). The intensity and size of areas of green fluorescence in the group treated with combined medication were much stronger and larger than those of red fluorescence when monitored post-injection (
Fig. 4C). Hence, Met and ABZ could cause damage to parasites and affect the viability of the protoscolices. We further demonstrated that the fluorescent signals of parasites of different levels of viability, as labeled by JC-1, can be captured in both in vivo and vitro studies. Subsequently, the control group was selected to monitor the gradient of fluorescence signals, which is a decisive factor in our model, because this group showed the highest viability of protoscolices among the groups studied (
Fig. 5A,
B). Both red and green fluorescence showed a gradual decay process corresponding to the decreasing viability of protoscolices (
Fig. 5C).
Previous research adopted mouse models, especially peritoneal implantation, in studies on
E. granulosus describing immunology and susceptibility testing assays [
25,
26]. None of these studies discussed the use of optical molecular imaging, which yields images reflecting the growth, metastasis, and in vivo mechanisms of diseases present within the context of physiologically authentic environments in a noninvasive manner [
14].
The in vivo imaging model of
E. granulosus we constructed presents a limited monitoring time, which means long-term dynamic monitoring cannot be achieved presently. Fluorescence imaging, only used for short-term effect of drugs on the viability of the protoscolices, was restricted by the degenerative trend of fluorescence inevitably. Therefore, we also exerted effort to achieve a persistent bioluminescence model characterized by non-invasiveness, high sensitivity, and simple operation in comparison with conventional imaging modalities [
16]. However, while most of the models that have been previously reported mainly concentrate on monocytes, such as stem and tumor cells [
27,
28], the plasmids we constructed failed to transfect protoscolices and achieve luciferase expression.
In summary, we believe that constructing a bioluminescence model of E. granulosus will be possible in future research. Given that the liver is the main tissue of drug actions and a target organ of hydatidosis, our study presents new routes for the development of small animal models of parasites that could be used to carry out effectiveness studies of anti-echinococcal drugs with in vivo models using a concentration assay that can be safely obtained in the clinical setting. Longitudinal monitoring of the growth and metastasis of parasites in the body, which will allow better options for studying this cestode, may also be achieved.
Notes
-
We have no conflict of interest related to this work.
This study was supported by the National Natural Science Foundation of China (grant nos. 81160200, 81060135, 811603 78, 30860263, 81260412, 81360453).
Fig. 1.Pharmacological sensitivity of metformin and its combination with albendazole sulfoxide on viability of protoscolices of Echinococcus granulosus. Viability of protoscolices incubated for 5 days with 10 mM Met alone and 10 mM Met+15 mM ABZSO in combination. Drug-free protoscolices were used as the control. Results are reported as the mean±SD of 3 independent studies. Statistically significant difference compared with the control group, *P<0.05; **P<0.01.

Fig. 2.Drug-induced apoptosis of protoscolices. Three groups of protoscolices were incubated with JC-1 dye. Images were collected using confocal microscopy, and fluorescence was quantified. Representative images are shown: (A-C) Fluorescence images of different groups (×200), (D, E) Red/green fluorescence ratios measured in the control and drug-treated protoscolices by Image J software. Statistically significant difference compared with the control group, **P<0.01. The scale bar indicates 200 μm (A-C).
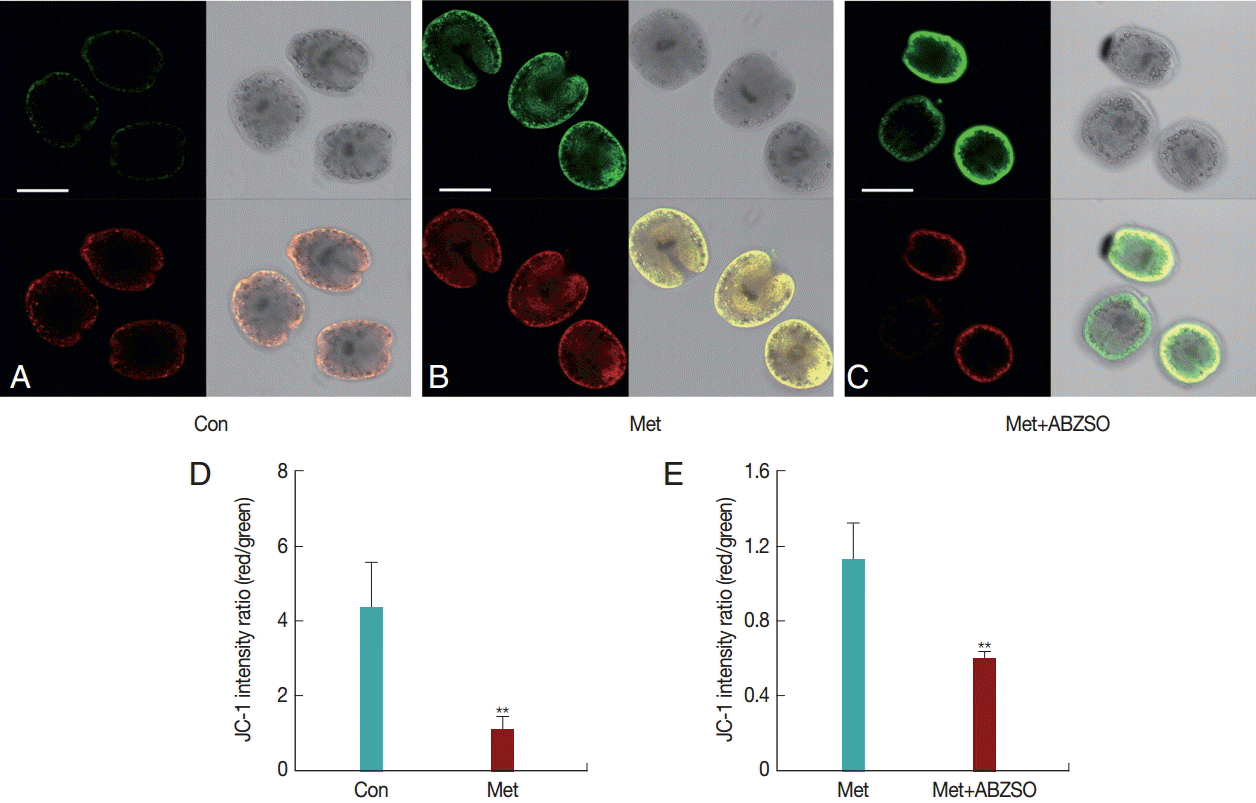
Fig. 3.In vitro imaging of protoscolices. (A, B) Quantitative analysis of fluorescence intensity of the drug-treated groups compared with the control. Optical imaging was performed using IVIS Spectrum; significance was tested using unpaired t-tests.
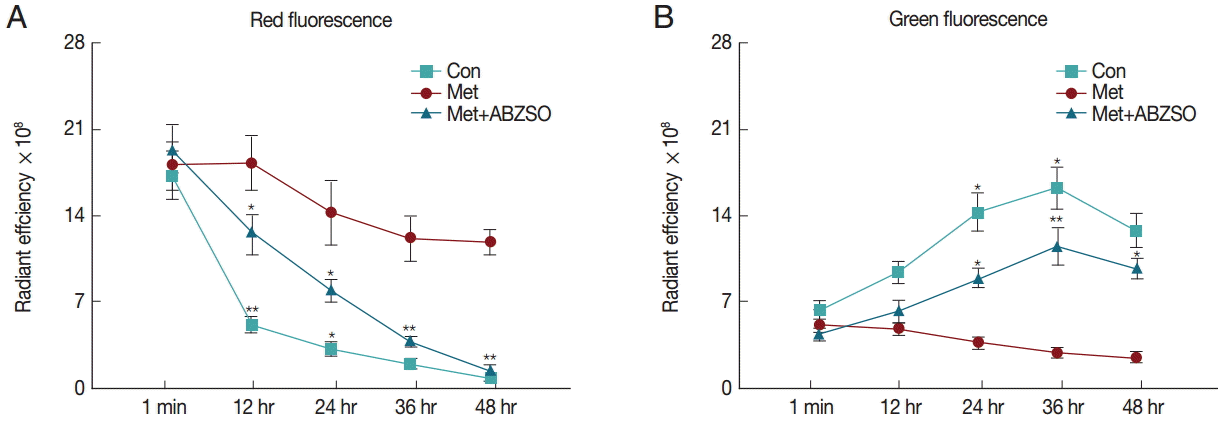
Fig. 4.Fluorescent imaging of JC-1-labeled protoscolices in vivo. (A-C) Representative whole body fluorescent images of E. granulosus mice in different drug-treatment groups after injection in the supine position. The red/yellow spots indicate fluorescence signals detected by IVIS Spectrum after injection. ROIs were created around the infected region for quantification of fluorescence intensities in each imaging set. The blue number represents real-time values of fluorescence intensity. (D, E) Red/green fluorescence ratios measured in drug-free and drug-treated protoscolices to represent the viability of protoscolices or level of apoptosis. Statistically significant difference compared with the positive control, **P<0.01.
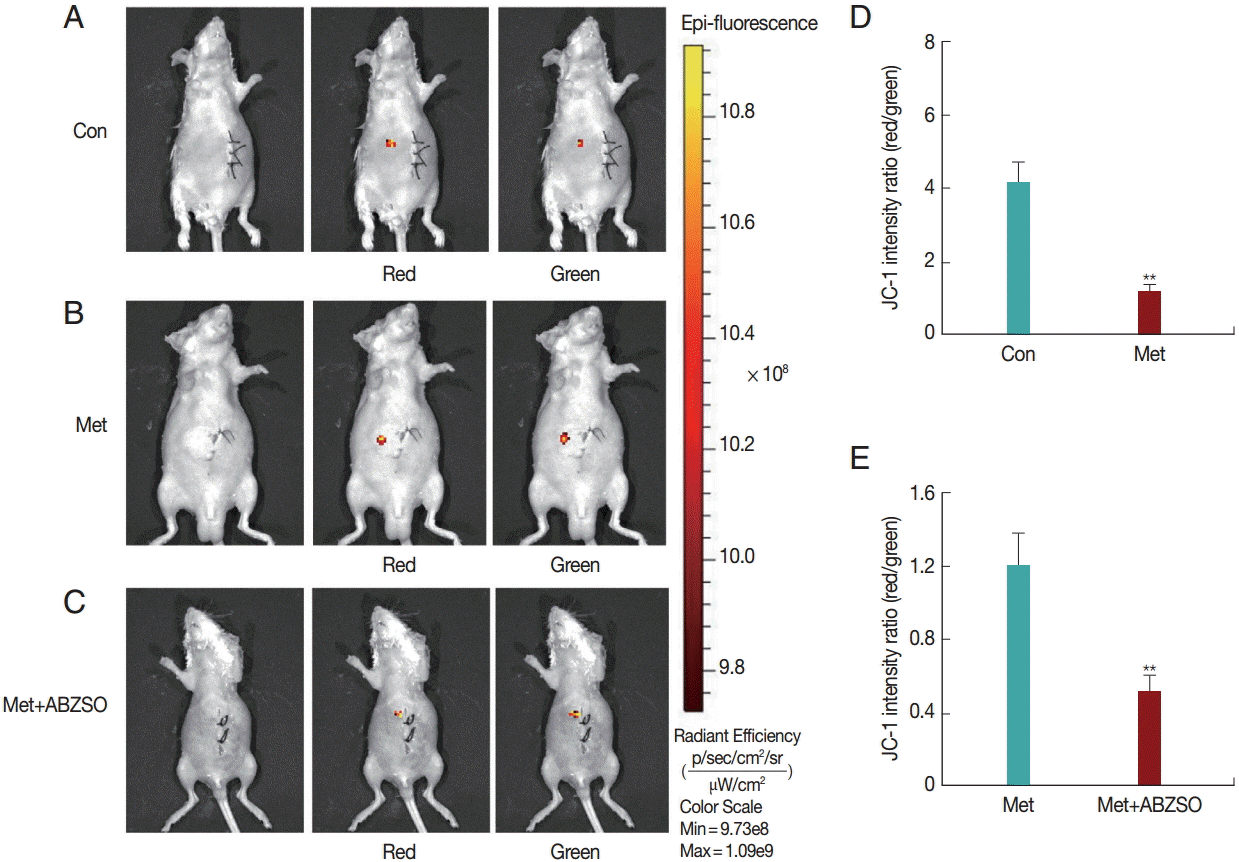
Fig. 5.In vivo analysis of fluorescent signals in protoscolices in mice. Fluorescence imaging was induced in E. granulosus mice via laparotomy treatment. Typical images of representative individual mice from the drug-free group. (A) Longitudinal observation of red fluorescence intensity in mice 1 min, 12 hr, 24 hr, and 36 hr post-injection. (B) Green fluorescence intensity at different exposure times. (c) Radiant efficiency of ROIs quantified as p/s/cm2/sr.
References
- 1. Al-Jawabreh A, Dumaidi K, Ereqat S, Nasereddin A, Al-Jawabreh H, Azmi K, Al-Laham N, Abdeen Z. Incidence of Echinococcus granulosus in domestic dogs in Palestine as revealed by Copro-PCR. PLoS Negl Trop Dis 2015;9:e0003934.
- 2. Grosso G, Gruttadauria S, Biondi A, Marventano S, Mistretta A. Worldwide epidemiology of liver hydatidosis including the Mediterranean area. World J Gastroenterol 2012;18:1425-1437.
- 3. Eckert J, Conraths FJ, Tackmann K. Echinococcosis: an emerging or re-emerging zoonosis? Int J Parasitol 2000;30:1283-1294.
- 4. Sadjjadi SM. Present situation of echinococcosis in the Middle East and Arabic North Africa. Parasitol Int 2006;55(suppl):S197-S202.
- 5. Torgerson PR, Karaeva RR, Corkeri N, Abdyjaparov TA, Kuttubaev OT, Shaikenov BS. Human cystic echinococcosis in Kyrgystan: an epidemiological study. Acta Trop 2003;85:51-61.
- 6. Tünger Ö. Epidemiology of cystic echinococcosis in the world. Turkiye Parazitol Derg 2013;37:47-52. (in Turkish).
- 7. Stojkovic M, Zwahlen M, Teggi A, Vutova K, Cretu CM, Virdone R, Nicolaidou P, Cobanoglu N, Junghanss T. Treatment response of cystic echinococcosis to benzimidazoles: a systematic review. PLoS Negl Trop Dis 2009;3:e524.
- 8. Junghanss T, da Silva AM, Horton J, Chiodini PL, Brunetti E. Clinical management of cystic echinococcosis: state of the art, problems, and perspectives. Am J Trop Med Hyg 2008;79:301-311.
- 9. Grozavu C, Ilias M, Pantile D. Multivisceral echinococcosis: concept, diagnosis, management. Chirurgia (Bucur) 2014;109:758-768.
- 10. Eckert J, Deplazes P. Biological, epidemiological, and clinical aspects of echinococcosis, a zoonosis of increasing concern. Clin Microbiol Rev 2004;17:107-135.
- 11. Falagas ME, Bliziotis IA. Albendazole for the treatment of human echinococcosis: a review of comparative clinical trials. Am J Med Sci 2007;334:171-179.
- 12. Kourelis TV, Siegel RD. Metformin and cancer: new applications for an old drug. Med Oncol 2012;29:1314-1327.
- 13. Quinn BJ, Kitagawa H, Memmott RM, Gills JJ, Dennis PA. Repositioning metformin for cancer prevention and treatment. Trends Endocrinol Metab 2013;24:469-480.
- 14. Massoud TF, Gambhir SS. Molecular imaging in living subjects: seeing fundamental biological processes in a new light. Genes Dev 2003;17:545-580.
- 15. Keyaerts M, Caveliers V, Lahoutte T. Bioluminescence imaging: looking beyond the light. Trends Mol Med 2012;18:164-172.
- 16. Chen ZY, Wang YX, Yang F, Lin Y, Zhou QL, Liao YY. New researches and application progress of commonly used optical molecular imaging technology. Biomed Res Int 2014;2014:429198.
- 17. Salani B, Del Rio A, Marini C, Sambuceti G, Cordera R, Maggi D. Metformin, cancer and glucose metabolism. Endocr Relat Cancer 2014;21:R461-R471.
- 18. Kasznicki J, Sliwinska A, Drzewoski J. Metformin in cancer prevention and therapy. Ann Transl Med 2014;2:57.
- 19. Gwinn DM, Shackelford DB, Egan DF, Mihaylova MM, Mery A, Vasquez DS, Turk BE, Shaw RJ. AMPK phosphorylation of raptor mediates a metabolic checkpoint. Mol Cell 2008;30:214-226.
- 20. Cumino AC, Lamenza P, Denegri GM. Identification of functional FKB protein in Echinococcus granulosus: its involvement in the protoscolicidal action of rapamycin derivates and in calcium homeostasis. Int J Parasitol 2010;40:651-661.
- 21. Reers M, Smith TW, Chen LB. J-aggregate formation of a carbocyanine as a quantitative fluorescent indicator of membrane potential. Biochemistry 1991;30:4480-4486.
- 22. Perry SW, Norman JP, Barbieri J, Brown EB, Gelbard HA. Mitochondrial membrane potential probes and the proton gradient: a practical usage guide. Biotechniques 2011;50:98-115.
- 23. El-Mir MY, Nogueira V, Fontaine E, Avéret N, Rigoulet M, Leverve X. Dimethylbiguanide inhibits cell respiration via an indirect effect targeted on the respiratory chain complex I. J Biol Chem 2000;275:223-228.
- 24. Ceballos L, Virkel G, Elissondo C, Canton C, Canevari J, Murno G, Denegri G, Lanusse C, Alvarez L. A pharmacology-based comparison of the activity of albendazole and flubendazole against Echinococcus granulosus metacestode in sheep. Acta Trop 2013;127:216-225.
- 25. Elissondo M, Ceballos L, Dopchiz M, Andresiuk V, Alvarez L, Bruni SS, Lanusse C, Denegri G. In vitro and in vivo effects of flubendazole on Echinococcus granulosus metacestodes. Parasitol Res 2007;100:1003-1009.
- 26. Nicolao MC, Elissondo MC, Denegri GM, Goya AB, Cumino AC. In vitro and in vivo effects of tamoxifen against larval stage Echinococcus granulosus. Antimicrob Agents Chemother 2014;58:5146-5154.
- 27. Chan KM, Raikwar SP, Zavazava N. Strategies for differentiating embryonic stem cells (ESC) into insulin-producing cells and development of non-invasive imaging techniques using bioluminescence. Immunol Res 2007;39:261-270.
- 28. Yeh CT, Rao YK, Ye M, Wu WS, Chang TC, Wang LS, Wu CH, Wu AT, Tzeng YM. Preclinical evaluation of destruxin B as a novel Wnt signaling target suppressing proliferation and metastasis of colorectal cancer using non-invasive bioluminescence imaging. Toxicol Appl Pharmacol 2012;261:31-41.


