Abstract
Mastophorus muris is a prevalent nematode parasite of rodents that can cause pathogenic manifestations or mortality. As the only 1 species in the genus Mastophorus and the sole member of the family Spirocercidae, its biology, molecular identification, and population genetic structure remain poorly studied. In this study, the complete mitochondrial genome of M. muris was fully assembled and annotated through high-fidelity next-generation sequencing for the first time, to resolve its molecular architecture with nucleotide-level precision. The 13,668 bp mitogenome encodes 36 genes, including 12 protein-coding genes (PCGs), 22 transfer RNAs, and 2 ribosomal RNAs (s-rRNA and l-rRNA). The 10,384 bp PCGs account for 76.0% of the mitogenome, with AT (71.7%) and GC (28.3%) contents, AT skew (-0.494) and GC skew (0.477), indicating pronounced nucleotide bias. Analysis of 12 PCGs revealed that TTG, ATT, ATA, or GTG were the common start codons. TAA was the predominant termination codon, while some PCGs (cob, nad1, and nad3) were deduced to end with an incomplete codon T. T-rich codons such as TTT-Phe (16.3%), TTG-Leu (8.5%), GTT-Val (6.7%), ATT-Ile (6.3%), TAT-Tyr (5.6%), TTA-Leu (4.6%), and TCT-Ser (4.3%) were used more frequently. Phylogenetic analysis using the concatenated nucleotide sequences of 12 PCGs, and the NJ tree analysis results showed that M. muris was more closely related to the genus Gongylonema, which indicated that the family Spirocercidae was more closely associated with Gongylonematidae. This study provides valuable mitogenomic data for nematode phylogeny, diagnostics, population genetics, and comparative mitogenomics.
-
Key words: Mitochondrial genome, Mastophorus muris, phylogenetic analysis, Spirocercidae
Introduction
The stomach nematode
Mastophorus muris (Gmelin, 1790) (Nematoda: Spiruroidea) is a cosmopolitan and important parasitic pathogen of wild and urban rodents (voles and rats), and even other less frequent hosts (marsupials and carnivores) [
1]. The genus
M. muris (Gmelin, 1790) was identified as nematode based on morphological similarities. The
M. muris body is elongated, medium in size, tail is coiled with a lateral lip on the head, with a keratinized mouth capsule and unequal copulatory spicule [
2]. While the life-cycles of all species in the family Spirocercidae involve 2 hosts, namely definitive and intermediate hosts. The life cycle of
Mastophorus spp. is indirect, with various insects (e.g., cockroaches, flour beetles, locusts, dipterans, and earwigs) acting as intermediate hosts. The infective larvae after being ingested by definitive hosts (e.g., rodents, rats, and voles), where it will develop into gravid adults in the stomach in 28 days [
3]. The breeding adult nematodes will shed their eggs inside the definitive hosts’ stomach, and these will be released into the open environment along with the definitive hosts’s faeces. The intermediate hosts (insects) will ingest the eggs, and then the larvae are developed, the definitive hosts will consume the intermediate hosts, thus continuing the life cycle of the
Mastophorus spp. nematode. In the current classification, the family Spirocercidae includes 6 genera, such as
Ascarops (1 species),
Cylicospirura (3 species),
Mastophorus (1 species and 7 unclassified species),
Physocephalus (2 species and 1 unclassified species),
Spirobakerus (1 species),
Streptopharagus (1 species and 1 unclassified species). The number of genera is so large and with a rich variety of species, but there are few studies investigating the phylogeny of the Spirocercidae including
Mastophorus.
Molecular biology tools have been used to study the phylogenetic relationships among groups of Spiruroidea nematodes [
4]. However, the limited availability of sequence data (amounts and length of sequences) has greatly hampered studies of the phylogenetic relationships among families in the order Spirocercidae. Compared to some genes (18S rRNA, 12S rRNA, and
cox1 gene), the complete mitochondrial DNA sequences are more appropriate and informative at the generic level [
5]. Complete mitochondrial DNA sequences can provide information not only about individual and combined mitochondrial genes, but also about the order of the genes [
6]. Mitochondrial gene rearrangements are generally rare events that occur over long evolutionary periods, although mitochondrial sequences evolve rapidly in metazoans [
7]. Relative gene rearrangements found in a group of species (insects and crustaceans) are considered evidence of a closer relationship among them [
8]. In fact, the use of gene rearrangement comparisons as a phylogenetic tool has been well discussed [
9], and has been used to analyse several evolutionary relationships in insects (
Aleurodicus rugioperculatus [
10] and
Pachyneuron aphidis [
11]), primate species [
12], birds [
13]. However, only 1 complete nematode mitochondrial genome sequences (
G. pulchrum NC_026687.1) are available for species of the order Spiruroidea in the National Center for Biotechnology Information (NCBI) database and no complete mitochondrial genome was available in the family Spirocercidae until now.
Overall, the present study aimed to characterize the complete mitochondrial genome of M. muris, the first representative of the family Spirocercidae; to compare its mitochondrial gene content, arrangement with those of other nematodes; and to infer the phylogenetic position of M. muris in relation to other nematodes based on the concatenated mitochondrial amino acid sequences.
Methods
Ethics statement
In the present study, no prior permission was required for the collection as the species (parasite host) is neither endangered nor protected in IUCN Red List or Law of the People’s Republic of China on the Protection of Wildlife. Furthermore, we followed all the applicable international, national, and/or institutional guidelines for the care and use of animals during experiment.
Sample collection, and DNA extraction
The individual parasitic nematode specimen of M. muris was collected in Qinghai vole (Neodon fuscus) from Maqin County, Qinghai Province, located in the Three Rivers Source Region of the Qinghai-Tibetan Plateau, China in August 2022. The morphological traits of the parasite specimen were promptly recognized by the Academy of Animal and Veterinary Sciences, Qinghai University, and then they were immediately preserved in 100% ethanol during collection and stored at -80 ℃ until DNA extraction. Total genomic DNA was extracted from the parasite body using the TlANamp Genomic DNA Kit (Tiangen Biotech) according to the manufacturer’s instructions. The quality of extracted DNA was detected by electrophoresis and ultraviolet spectrophotometer—specifically the NanoDrop 2000 (Thermo Fisher Scientific), and the genomic DNA was stored at -20℃ until PCR amplification.
PCR amplification identification and sequencing
In order to identify the suspected parasitic nematode, a fragment from the cytochrome c oxidase subunit 1 (cox1) was amplified with primers cox1F (5'-CTCGTGTTAATGCTTTGTCTTTTT-3') and cox1R (5'-AGCAGTACTCAAAATAATACCTCTT-3'), and another from the 18S rRNA gene was amplified with primers 18S F1 (5'-TGGATAACTGTGGTAATTCTAGAGC-3') and 18S R1 (5'-TTAATGATCCTTCCGCAGGT-3'). The PCR was performed on Nexus GX2 Thermal Cycler (Eppendorf) in 50.0 μl reaction volumes containing 2.0 μl of template DNA, 2.0 μl of each primer (10 μmol/L), 25.0 μl TaKaRa PrimeSTAR Max Premix (2×), and 19.0 μl sterilized distilled water. Condition for PCR amplification was as follows: an initial denaturation for 5 min at 98°C followed by 35 cycles of denaturation for 20 sec at 98°C, annealing for 30 sec at 54°C and extending for 2 min at 72°C, finally reactions were held at 72°C for 10 min. The PCR products were assessed through electrophoresis in 1.5% agarose gel, stained with GelStain, and photographed under ultraviolet light, and then the PCR products were sequenced and aligned using BLAST in NCBI database to identify the parasite species.
Mitochondrial genome sequencing and assembly
After precise identification of the parasite species, the mitogenomes of
M. muris were sequenced by next-generation sequencing on the illumina HiseqXten/Novaseq/MGI2000 System (Genewiz Biotechnology). Raw sequences data were performed with quality control and then the clean data were
de novo assembled by the NOVOPlasty software [
14]. The MITOS2 gene-finding software had been used for finding coding genes [
15]. tRNAs were detected in the genome using the program tRNAscan-SE with default parameter settings [
16]. Furthermore, rRNA and tRNAs were identified by using RNAmmer [
17]. We also compared the assembled genome with the previous 2 confirmed sequences by PCR and Sanger sequencing methods to evaluate the single-base accuracy of the assembled mitogenome.
The genes sequences were annotated with NCBI nr database by Nucleotide BLAST (
https://blast.ncbi.nlm.nih.gov/Blast.cgi) and by comparison with
G. pulchrum (NC_026687.1) and
Spirocerca lupi (NC_021135.1) to ensure that the sequences were correct. The locations of the protein-coding genes (PCGs) were identified using ORF Finder via NCBI and MITOS WebServer (
http://mitos2.bioinf.uni-leipzig.de/index.py) comparing with the selection of invertebrate mitochondrial genetic code by the default settings. The ClustalX program was used to observe and identify the start/stop codon of PCGs, especially, the abnormal start/stop codons were identified and manually corrected once again on the basis of comparison with other nematode species [
18]. The MEGA X was used to align the PCGs with other nematode species, and then the relative synonymous codon usage (RSCU) was also obtained, noteworthily, the incomplete codons were removed when the RSCU was calculated using PCGs [
19]. In addition, the boundaries of rRNA genes were determined based on the locations of adjacent tRNA genes and by alignment with homologous genes of other related nematodes using DNAMAN version 8.0 (Lynnon Biosoft). The composition skew values were calculated according to the following formulae: AT skew=(A-T)/(A+T) and GC skew=(G-C)/(G+C) [
20], where A, T, G, and C denoted the percentages of the 4 bases [
21]. Functional annotations were performed using protein sequence similarity BLAST searches with the typical cut-off E-value of 10
-5 against several publicly available protein databases: the NCBI non-redundant protein database, Swiss-Prot, Clusters of Orthologous Groups, and Gene Ontology terms [
22]. The secondary cloverleaf structures of tRNAs were predicted using the MITOS WebServer (
http://mitos2.bioinf.uni-leipzig.de/index.py). The tandem repeats in A+T-rich regions were predicted using the Tandem Repeats Finder program(
http://tandem.bu.edu/trf/trf.basic.submit.html). The graphical map of the complete mitochondrial genome was drawn using the online mitochondrial visualization tool Organellar Genome DRAW [
23]. The overlapping and intergenic spacer regions were examined manually. The assembled mitogenome with gene features was submitted to GenBank: Bankit (NCBI) to get the accession number (
https://www.ncbi.nlm.nih.gov/WebSub/).
To reconstruct phylogenetic trees for the estimation of M. muris taxonomic status, 32 available nematode species mitogenomes were retrieved and downloaded from the GenBank, and used in the present study along with newly generated M. muris sequence. In addition, the mitogenome of Schistosoma mansoni (NC_002545.1, Trematoda) were used as the outgroup and included in each analysis. Phylogenetic analyses were performed using the concatenated nucleotide sequences of all the 12 PCGs and 2 rRNAs. Subsequently, the nucleotide sequences were concatenated into a single alignment and converted into phylip and nexus format files for phylogenetic analyses, which were performed using Neighbor-Joining tree method. Comparative analyses were carried out using the MEGA software (version 5.0), by comparing the distribution of the arrangement of individual genes in this order, in particular, the arrangement of tRNA genes among the PCGs.
Results
Morphological characteristics observation
The parasitic nematode was collected from the stomach of Qinghai voles and examined under a stereomicroscope. The worms were elongated and medium sized, reaching up to 80.0 mm in length. The tail was coiled, the head bore lateral lips, and a keratinized buccal capsule and unequal copulatory spicules were present. Females were considerably larger than males, lacked a copulatory bursa, and possessed prominent caudal alae. The right spicule was long and blunt, while the left was shorter and pointed, consistent with previous morphological descriptions [
1].
Genomic DNA was extracted from the nematode and subjected to PCR amplification targeting the cox1 and 18S rRNA genes. Two distinct bands of approximately 797 bp and 1,664 bp were obtained, matching the expected amplicon sizes. Following sequencing, BLAST searches against GenBank revealed high sequence identities with M. muris: 98.3% for cox1 (MG821081.2) and 99.8% for 18S rRNA (MG818763.2). These results confirmed that the nematode isolate was M. muris.
Structure of the complete mitochondrial genome
The complete mitochondrial genome of
M. muris was a circular double-stranded DNA molecule13,668 bp in length (GenBank accession No. NC_085209.1). It encoded 36 genes: 12 PCGs (
cox1–3,
nad1–6,
cob,
nad4L, and
atp6), 2 ribosomal RNA genes (
s-rRNA and
l-rRNA), 22 transfer RNA genes (tRNAs), and non coding control regions (
Fig. 1;
Table 1). Similar to other nematode and flatworm mitogenomes, the
atp8 gene was absent [
20]. All genes were transcribed unidirectionally from the plus strand. The nucleotide composition was 21.1% A, 52.0% T, 7.1% C, and 19.8% G, with an overall AT content of 73.1% and GC content of 26.9%. The mitogenome exhibited negative AT skew (-0.422) and positive GC skew (0.470).
The 12 PCGs spanned 10,384 bp, accounting for 76.0% of the total mitogenome (
Table 2). The AT and GC contents were 71.7% and 28.3%, respectively (
Table 3). The AT skew was -0.494 and the GC skew was 0.477, indicating strong nucleotide compositional bias (
Table 4).
Six PCGs (
cob,
nad4L,
nad1,
nad3,
nad4, and
nad5) used TTG as the initiation codon, 2 (
cox1 and
cox3) used ATG, 1 (
nad6) used ATT, 1 (
atp6) used ATC, 1 (
cox2) used ATA, and 1 (
nad2) used GTG. Nine PCGs terminated with complete stop codons (TAA or TAG), whereas
cob,
nad1, and
nad3 ended with the incomplete stop codon T. The lengths of the deduced proteins were comparable to those of other nematodes (
Table 2).
Several overlaps were detected: 1-bp overlaps between trnM-trnK, trnS2-trnP, trnE-trnS1, cox3-trnL1, and nad5-trnE; 2-bp overlaps between nad6-trnR and nad3-trnC; and a 3-bp overlap between trnY-nad1.
Ribosomal and transfer RNA genes
The large ribosomal RNA (
l-rRNA) was located between
trnH and
nad3, and the
s-rRNA gene between
nad4L and
trnY (
Table 1). Their lengths were 947 bp and 641 bp, respectively. A total of 22 tRNA genes were identified, ranging from 52 to 69 bp, with a cumulative length of 1,230 bp (excluding overlaps), representing ~9.0% of the mitogenome. The AT content was 76.9%, with negative AT skew (-0.184) and positive GC skew (0.488). Gene order was identical to that of
S. lupi and
Setaria digitata. Twenty tRNAs displayed the typical TV replacement loop structure, while trnS1 and trnS2 lacked the DHU loop but retained the TΨC loop.
RSCU was analyzed for the 12 PCGs (
Table 5;
Supplementary Table S1). Among the 64 possible codons, 62 were used; CAC (His) and CGC (Arg) were absent. T-rich codons, including TTT (Phe), TTG (Leu), GTT (Val), ATT (Ile), TAT (Tyr), TTA (Leu), and TCT (Ser), were strongly preferred. Codons with high C content were markedly underrepresented. This pattern reflected a strong codon usage bias toward T in the
M. muris mitogenome.
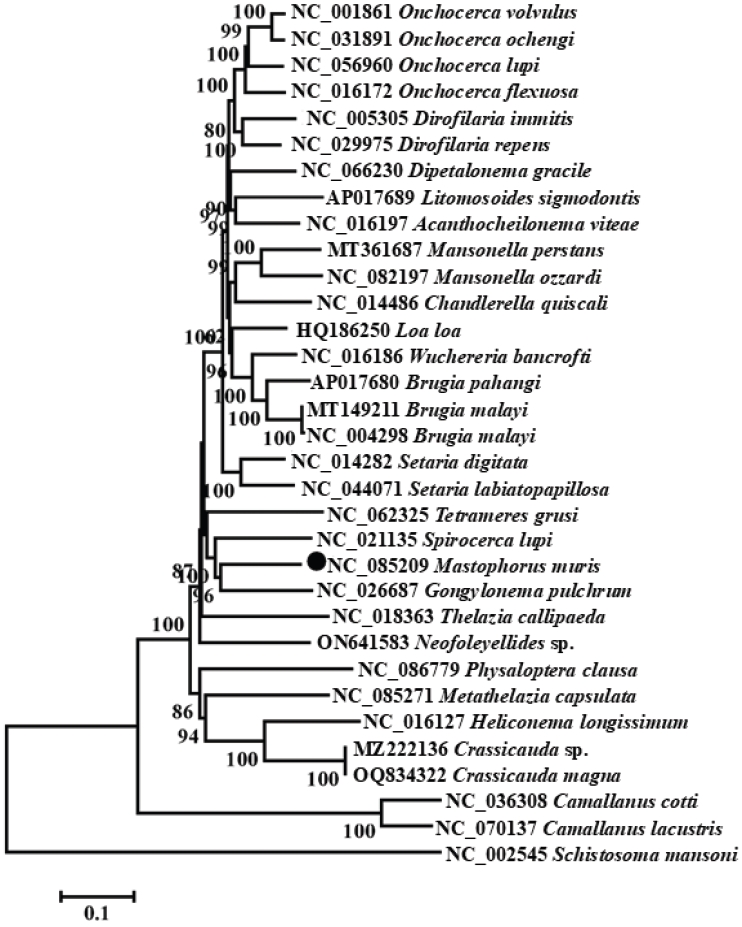
Phylogenetic trees were constructed using the neighbor joining method based on concatenated nucleotide sequences of 12 PCGs plus 2 rRNA genes from
M. muris and 30 other Spiruromorpha species (
Figs. S1-
S14). The phylogenetic topology showed that
M. muris clustered closely with
G. pulchrum (Gongylonematidae, Spiruroidea) with high support (
Fig. 2). Members of Spirocercidae and Gongylonematidae formed a monophyletic group within Spiruroidea, which was paraphyletic with respect to Tetrameridae (Habronematoidea) and Thelaziidae (Thelazioidea).
Single gene phylogenetic analyses revealed that cox1, cox3, cob, nad1, nad4, nad4L, nad5, nad6, l-rRNA, and s-rRNA produced relatively stable topologies. Notably, nad1, nad4, nad4L, and s-rRNA recovered a tree topology identical to that based on the full mitogenome dataset.
Discussion
Although morphological characteristics observed in the present study were consistent with previous descriptions, accurate species level identification of parasitic nematodes based solely on gross morphology remains difficult due to high morphological similarity and phenotypic plasticity among related taxa [
1]. Molecular identification provides higher accuracy and resolution than traditional morphological approaches, and thus represents a more reliable tool for species delimitation.
In the present study, the nematode isolated from the stomach of Qinghai voles was molecularly identified as M. muris based on high sequence identities of cox1 and 18S rRNA genes. At the time of writing, only one complete mitochondrial genome was available for species of the superfamily Spiruroidea in the NCBI database (G. pulchrum, NC_026687.1), and no mitochondrial genome had been reported for the family Spirocercidae. Therefore, characterization of the M. muris mitogenome fills an important taxonomic gap and enriches the mitochondrial genomic resources for Spirocercidae.
The
M. muris mitogenome exhibits several typical features of nematode mitogenomes, including the absence of the
atp8 gene, unidirectional transcription of all genes from the same strand, and high AT content [
20]. Incomplete stop codons (T) detected in three PCGs are commonly observed in nematode mitochondrial genomes and are believed to be completed to TAA via post transcriptional polyadenylation [
24-
29]. Gene overlaps between tRNA genes are common in metazoan mitogenomes [
30,
31]; however, overlaps between protein coding genes and tRNA genes are relatively rare, but have been reported in some flatworms and other helminths [
6,
32].
The
M. muris mitogenome displays a strong codon usage bias toward T-rich codons and low usage of C-rich codons, a pattern widely observed in spirurid nematodes such as
Dirofilaria immitis,
S. digitata,
Onchocerca volvulus, and
Brugia malayi [
27,
33,
34]. This conserved bias likely reflects strong mutational pressure and selection associated with the high AT content typical of nematode mitogenomes.
Most tRNA genes of
M. muris possess the typical TV replacement loop, whereas
trnS1 and
trnS2 lack the DHU arm, a common feature in nematodes [
24,
35]. The gene order and arrangement are highly similar to those of
S. lupi and
S. digitata [
33], supporting conserved mitochondrial architecture within Spiruromorpha.
Phylogenetic analysis based on concatenated mitochondrial sequences showed that M. muris clusters closely with G. pulchrum with high nodal support. Members of Spirocercidae and Gongylonematidae formed a monophyletic group within Spiruroidea, which was paraphyletic with respect to Tetrameridae (Habronematoidea) and Thelaziidae (Thelazioidea). These results are consistent with recent mitochondrial phylogenomic studies of Spiruromorpha and challenge traditional morphology based classification systems.
Single gene phylogenetic analyses revealed that
nad1,
nad4,
nad4L, and
s-rRNA produced topologies highly consistent with the full mitogenome dataset. These genes may serve as suitable molecular markers for species identification and phylogenetic analysis of Spiruroidea, although wider validation is needed with increased taxon sampling, particularly for the genus
Mastophorus [
27,
33,
35].
In conclusion, this study presents the first complete mitochondrial genome of M. muris, representing the first mitogenome for the family Spirocercidae. Comparative and phylogenetic analyses improve our understanding of the systematic relationships, genome evolution, and codon usage patterns within Spiruromorpha. This mitogenome provides a valuable resource for developing molecular diagnostic tools, studying population genetics, and exploring host–parasite co evolution and adaptive diversification in spirurid nematodes.
Notes
-
Data availability
Sequence data that support the findings of this study have been deposited in the GenBank with the primary accession number NC_085209.1.
-
Author contributions
Conceptualization: Jian Y. Formal analysis: Jian Y. Funding acquisition: Jian Y. Investigation: Jian Y. Methodology: Jian Y. Resources: Jian Y. Writing – original draft: Jian Y. Writing – review & editing: Jian Y.
-
Conflict of interest
The authors have no conflicts of interest to declare.
-
Funding
This study was supported by the Base and Talent Project of the Department of Science and Technology of the Tibet Autonomous Region (XZ202401JD0012), Project for Transformation of Scientific and Technological Achievements of the Key Research and Development, and Transformation Programmes of the Qinghai Provincial Science and Technology Department (2023-NK-135), Qinghai Province “Kunlun Talents ⋅ Highend Innovation and Entrepreneurial Talents” Top Talent Project (No. 2024) and National Natural Science Foundation of China (No. 32360889).
-
Acknowledgments
The author is grateful to the rodent extermination worker for helping with collecting the nematode samples.
Supplementary information
Fig. 1.The mitochondrial genome of Mastophorus muris. Genome organization of the complete mitochondrial genome of M. muris is a circular DNA molecule containing 36 genes. All genes are coded by the same DNA strand and are transcribed in the same direction. Protein-coding and rRNA genes are shown with the standard nomenclature. Gene scaling is approximate.
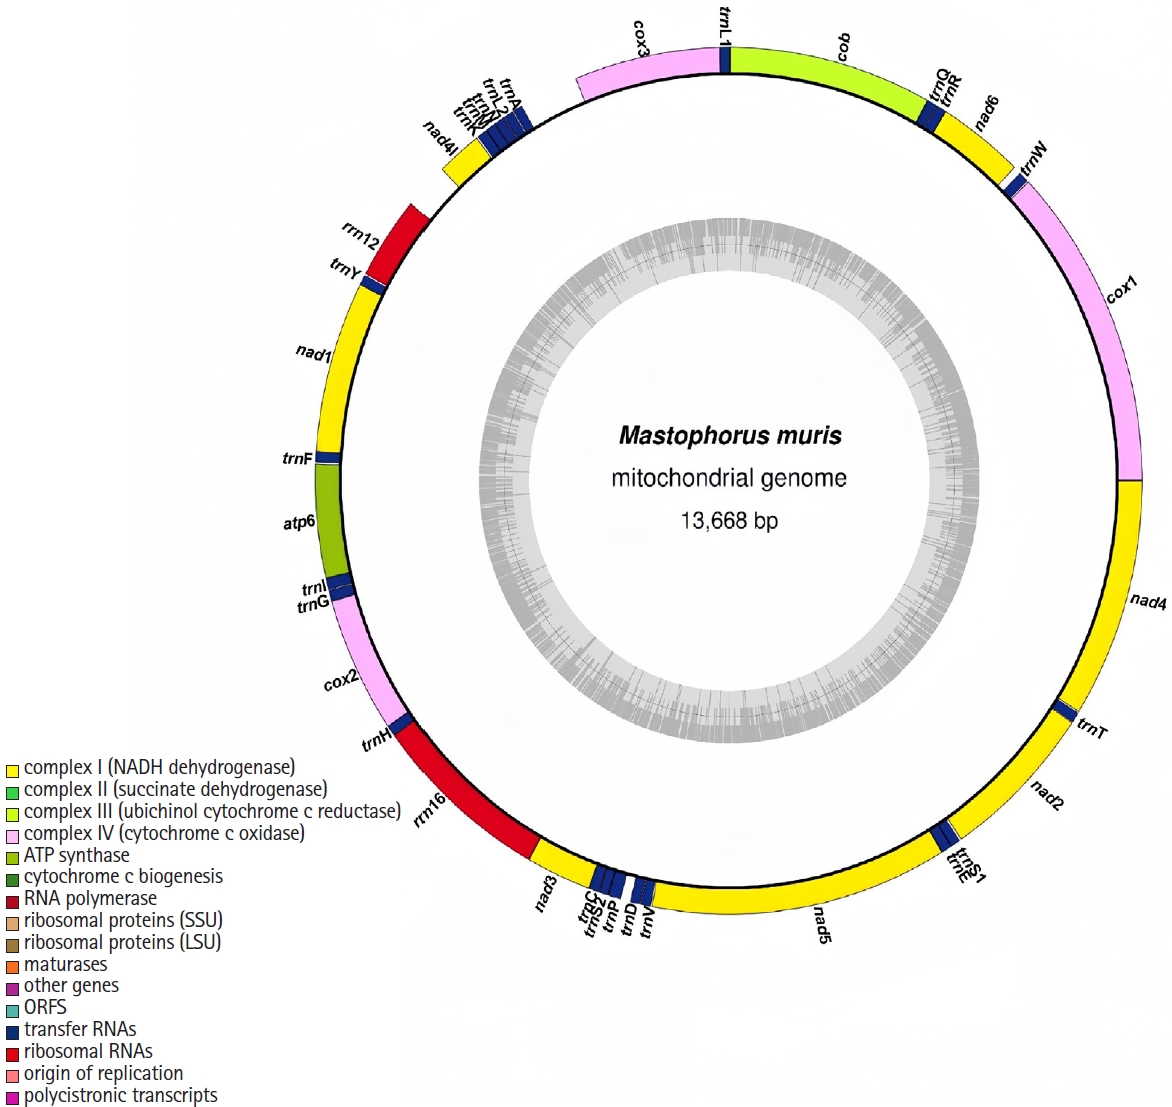
Fig. 2.Phylogenetic relationships among 30 species of selected Spiruromorpha nematodes inferred from neighbor-joining method of nucleotide sequences of 12 mitochondrial protein-coding genes. Schistosoma mansoni was used as the outgroup. Black dots represented Mastophorus muris.

Table 1.Summary data for the annotated mitochondrial genome of Mastophorus muris
Table 1.
|
Gene |
Position/length |
Initiation/termination codon |
Anticodon |
No. of amino acids |
No. of intergenic nucleotides |
|
cox1 |
1-1656/1656 |
ATG/TAA |
- |
551 |
+1 |
|
trnW (tRNA-Trp) |
1662-1719/58 |
- |
TCA |
- |
+5 |
|
Non-coding region (NC1) |
1720-1757/38 |
- |
- |
- |
0 |
|
nad6 |
1758-2219/462 |
ATT/TAA |
- |
142 |
0 |
|
trnR (tRNA-Arg) |
2218-2272/55 |
- |
ACG |
- |
-1 |
|
trnQ (tRNA-Trp) |
2274-2327/54 |
- |
TTG |
- |
+1 |
|
cob
|
2327-3414/1088 |
TTG/TAA |
- |
362 |
-1 |
|
trnL1 (tRNA-Leu) |
3414-3468/55 |
- |
TAG |
- |
-1 |
|
cox3 |
3468-4247/780 |
ATG/TAA |
- |
259 |
-1 |
|
Non-coding region (NC2) |
4248-4562/315 |
- |
- |
- |
0 |
|
trnA (tRNA-Ala) |
4563-4614/52 |
- |
TGC |
- |
0 |
|
trnL2 (tRNA-Leu) |
4618-4671/54 |
- |
TAA |
- |
+3 |
|
trnN (tRNA-Asn) |
4673-4729/57 |
- |
GTT |
- |
+1 |
|
trnM (tRNA-Met) |
4730-4785/56 |
- |
CAT |
- |
0 |
|
trnK (tRNA-Lys) |
4785-4841/57 |
- |
CTT |
- |
-1 |
|
nad4l |
4849-5091/243 |
TTG/TAA |
- |
80 |
+7 |
|
s-rRNA |
5092-5752/661 |
- |
- |
- |
0 |
|
trnY (tRNA-Tyr) |
5759-5813/55 |
- |
GTA |
- |
+6 |
|
nad1 |
5811-6687/877 |
TTG/TAA |
- |
291 |
-3 |
|
trnF (tRNA-Phe) |
6688-6742/55 |
- |
GAA |
- |
0 |
|
atp6 |
6750-7328/579 |
ATC/TAG |
- |
192 |
+7 |
|
trnI (tRNA-Ile) |
7329-7387/59 |
- |
GAT |
- |
0 |
|
trnG (tRNA-Gly) |
7390-7446/57 |
- |
TCC |
- |
+2 |
|
cox2 |
7447-8145/699 |
ATA/TAA |
- |
232 |
0 |
|
trnH (tRNA-His) |
8146-8200/55 |
- |
GTG |
- |
0 |
|
l-rRNA |
8201-9147/947 |
- |
- |
- |
0 |
|
nad3 |
9148-9496/349 |
ATG/T |
- |
115 |
0 |
|
trnC (tRNA-Cys) |
9497-9552/56 |
- |
GCA |
- |
-2 |
|
trnS2 (tRNA-Ser) |
9553-9604/52 |
- |
TGA |
- |
0 |
|
trnP (tRNA-Pro) |
9604-9672/69 |
- |
AGG |
- |
-1 |
|
Non-coding region (NC3) |
9673-9722/50 |
- |
- |
- |
0 |
|
trnD (tRNA-Asp) |
9723-9779/57 |
- |
GTC |
- |
0 |
|
trnV (tRNA-Val) |
9781-9834/54 |
- |
TAC |
- |
+1 |
|
nad5 |
9839-11428/1590 |
TTG/TAG |
- |
529 |
+4 |
|
trnE (tRNA-Glu) |
11428-11485/58 |
- |
TTC |
- |
-1 |
|
trnS1 (tRNA-Ser) |
11485-11537/53 |
- |
TCT |
- |
-1 |
|
nad2 |
11546-12382/837 |
GTG/TAG |
- |
278 |
+8 |
|
trnT (tRNA-Thr) |
12384-12438/55 |
- |
TGT |
- |
+1 |
|
nad4 |
12444-13667/1224 |
ATG/TAA |
- |
402 |
+5 |
Table 2.Properties of protein-coding genes, length of the mt genomes and rRNA genes and AT content of nematode mt genomes
Table 2.
|
Gene |
Species |
|
B. m.
|
W. b.
|
M. p.
|
C. m.
|
C. l.
|
S. d.
|
G. p.
|
H. l.
|
S. l.
|
M. m.
|
|
No. of aa |
|
cox1 |
548 |
548 |
550 |
548 |
517 |
548 |
550 |
530 |
551 |
551 |
|
nad6 |
158 |
150 |
142 |
145 |
157 |
149 |
143 |
145 |
152 |
153 |
|
cob
|
362 |
362 |
362 |
360 |
365 |
360 |
354 |
362 |
351 |
362 |
|
cox3 |
259 |
259 |
259 |
258 |
253 |
259 |
257 |
258 |
259 |
259 |
|
nad4l |
71 |
80 |
77 |
88 |
77 |
80 |
75 |
77 |
75 |
80 |
|
nad1 |
292 |
292 |
292 |
290 |
286 |
299 |
290 |
289 |
292 |
291 |
|
atp6 |
193 |
193 |
194 |
191 |
222 |
193 |
188 |
192 |
194 |
192 |
|
cox2 |
232 |
233 |
233 |
231 |
226 |
232 |
230 |
231 |
229 |
232 |
|
nad3 |
94 |
112 |
81 |
112 |
111 |
113 |
113 |
108 |
111 |
107 |
|
nad5 |
512 |
531 |
516 |
531 |
526 |
531 |
527 |
529 |
530 |
529 |
|
nad2 |
273 |
281 |
278 |
275 |
272 |
284 |
276 |
282 |
280 |
278 |
|
nad4 |
409 |
409 |
413 |
405 |
407 |
409 |
402 |
408 |
401 |
407 |
|
Length of rRNA gene (bp) |
|
s-rRNA |
672 |
672 |
665 |
571 |
709 |
672 |
681 |
682 |
688 |
661 |
|
l-rRNA |
1034 |
972 |
1016 |
765 |
937 |
971 |
965 |
973 |
987 |
947 |
|
Deduced initiation codon |
|
cox1 |
ATT |
ATT |
ATG |
AAT |
TTG |
ATT |
ATG |
ATT |
ATG |
ATG |
|
nad6 |
TTG |
--- |
GTG |
ATT |
ATT |
TTG |
ATT |
ATA |
TTG |
ATT |
|
cob
|
ATT |
ATT |
ATG |
GTG |
ATT |
ATT |
ATT |
ATT |
ATG |
TTG |
|
cox3 |
ATT |
ATT |
ATT |
TTG |
ATT |
ATA |
TTG |
ATT |
ATT |
ATG |
|
nad4l |
TTG |
GTA |
TTG |
TTG |
TTG |
TTG |
TTG |
ATA |
ATG |
TTG |
|
nad1 |
TTG |
TTG |
TTG |
ATT |
TTG |
TTG |
TTG |
TTG |
TTG |
TTG |
|
atp6 |
ATT |
ATA |
ATT |
TTG |
TTG |
TTT |
TTG |
ATT |
ATT |
ATC |
|
cox2 |
ATT |
ATT |
ATT |
TTG |
TTG |
ATT |
ATG |
ATT |
ATG |
ATA |
|
nad3 |
ATA |
CTT |
ATG |
ATT |
TTG |
TTT |
GTG |
ATA |
TTG |
TTG |
|
nad5 |
TTG |
TTT |
ATA |
TTT |
TTG |
TTT |
TTG |
ATT |
TTG |
TTG |
|
nad2 |
ATG |
TTA |
TTG |
ATT |
GTG |
TTT |
ATT |
TTG |
TTG |
GTG |
|
nad4 |
TTG |
TTG |
TTG |
ATT |
ATG |
ATG |
ATT |
ATA |
TTG |
TTG |
|
Deduced termination codon |
|
cox1 |
TAG |
TAA |
TAA |
TAA |
TAG |
TAG |
TAA |
TAA |
TAA |
TAA |
|
nad6 |
TAA |
TAA |
TAG |
TAA |
TAA |
TAA |
TAA |
TAA |
TAA |
TAA |
|
cob
|
GTT |
TAA |
TAA |
TAA |
TAA |
TAA |
TAA |
TAA |
TAA |
T |
|
cox3 |
TAA |
TAA |
TAA |
TAA |
TAA |
TAA |
TAA |
TAA |
TAA |
TAA |
|
nad4l |
TAA |
TAA |
TAG |
TAG |
TAA |
TAA |
TAA |
TAA |
TAG |
TAA |
|
nad1 |
TAA |
TAA |
TAA |
TAA |
TAG |
TAA |
TAA |
TAA |
TAA |
T |
|
atp6 |
TAG |
TAG |
TAA |
TAA |
TAA |
TAG |
TAA |
TAG |
TAA |
TAG |
|
cox2 |
TAA |
TAA |
TAG |
TAA |
TAA |
TAG |
TAA |
TAA |
TAA |
TAA |
|
nad3 |
TAG |
TAA |
TAA |
TAA |
TAA |
TAA |
TAA |
TAG |
TAA |
T |
|
nad5 |
TAG |
TAG |
TAA |
TAA |
TAA |
TAG |
TAA |
TAG |
TAA |
TAG |
|
nad2 |
TTT |
TAA |
TAA |
TAA |
TAA |
TAG |
TAG |
TAA |
TAG |
TAG |
|
nad4 |
TAA |
TAA |
TAG |
TAA |
TAG |
TAA |
TAA |
TAA |
TAG |
TAA |
|
Length of mt genome (bp) |
13658 |
13635 |
13619 |
13604 |
18935 |
13839 |
13798 |
13610 |
13804 |
13668 |
|
AT content of complete mt genome (%) |
75.5 |
74.6 |
74.1 |
75.0 |
75.9 |
75.1 |
76.0 |
79.1 |
74.4 |
73.1 |
Table 3.Comparison of A+T content (%) of gene and region of the mt genomes of Spiruromorpha nematode species, including Mastophorus muris
Table 3.
|
Gene |
Species |
|
B. m.
|
W. b.
|
M. p.
|
C. m.
|
C. l.
|
S. d.
|
G. p.
|
H. l.
|
S. l.
|
M. m.
|
|
cox1 |
67.9 (1119) |
67.7 (1115) |
67.2 (1110) |
67.2 (1106) |
65.3 (1014) |
69.1 (1138) |
68.6 (1134) |
71.7 (1142) |
67.4 (1116) |
67.6 (1120) |
|
nad6 |
81.6 (389) |
80.0 (361) |
77.4 (332) |
82.7 (362) |
73.4 (348) |
82.4 (371) |
81.0 (350) |
81.7 (358) |
77.3 (355) |
77.3 (357) |
|
cob
|
74.2 (806) |
72.7 (791) |
73.2 (796) |
72.6 (785) |
70.2 (769) |
72.3 (782) |
74.7 (796) |
79.3 (862) |
72.8 (767) |
72.6 (790) |
|
cox3 |
72.8 (568) |
74.3 (579) |
74.4 (580) |
73.1 (568) |
69.6 (529) |
72.6 (566) |
73.0 (565) |
75.9 (590) |
70.6 (551) |
71.3 (556) |
|
nad4l |
81.0 (175) |
80.7 (196) |
75.6 (177) |
76.4 (204) |
75.6 (177) |
76.8 (185) |
77.6 (177) |
82.1 (192) |
78.5 (179) |
76.1 (185) |
|
nad1 |
73.7 (646) |
72.5 (636) |
73.2 (642) |
72.9 (636) |
68.6 (591) |
72.8 (655) |
73.0 (636) |
75.7 (657) |
75.0 (659) |
70.2 (616) |
|
atp6 |
75.3 (438) |
76.6 (446) |
73.7 (431) |
75.6 (434) |
70.6 (471) |
74.2 (432) |
78.6 (444) |
77.9 (451) |
75.2 (440) |
72.9 (422) |
|
cox2 |
69.2 (484) |
70.6 (494) |
68.2 (479) |
68.8 (479) |
65.8 (447) |
69.4 (485) |
71.6 (495) |
74.7 (520) |
69.0 (475) |
67.2 (470) |
|
nad3 |
77.9 (222) |
76.9 (259) |
75.4 (184) |
76.9 (259) |
72.2 (241) |
77.1 (262) |
82.9 (282) |
83.2 (272) |
81.0 (272) |
77.4 (270) |
|
nad5 |
74.1 (1141) |
74.7 (1192) |
73.1 (1134) |
74.8 (1193) |
73.2 (1157) |
74.8 (1194) |
75.0 (1186) |
78.9 (1255) |
73.1 (1163) |
71.6 (1138) |
|
nad2 |
77.1 (632) |
75.7 (639) |
75.7 (632) |
79.5 (658) |
73.3 (599) |
76.5 (654) |
77.9 (647) |
82.9 (704) |
74.9 (631) |
74.6 (624) |
|
nad4 |
76.7 (943) |
73.9 (908) |
75.9 (942) |
76.9 (936) |
71.9 (880) |
76.9 (946) |
76.2 (933) |
80.4 (986) |
74.5 (898) |
73.6 (901) |
|
PCGs |
73.9 (7563) |
73.4 (7616) |
72.8 (7439) |
73.8 (7620) |
70.3 (7223) |
73.7 (7670) |
74.5 (7645) |
77.8 (7989) |
72.8 (7506) |
71.7 (7449) |
|
Complete mt genome |
75.5 (10314) |
74.6 (10170) |
74.1 (10090) |
75.0 (10198) |
75.9 (14371) |
75.1 (10398) |
76.0 (10479) |
79.1 (10767) |
74.4 (10268) |
73.1 (9991) |
Table 4.Nucleotide content and skewness (AT-skew/GC-skew) of Spiruromorpha mitochondrial PCGs and rRNAs, including Mastophorus muris
Table 4.
|
Gene |
Species (AT-skew/GC-skew) |
|
B. m.
|
W. b.
|
M. p.
|
C. m.
|
C. l.
|
S. d.
|
G. p.
|
H. l.
|
S. l.
|
M. m.
|
|
cox1 |
-0.382/0.258 |
-0.433/0.301 |
-0.387/0.289 |
-0.356/0/295 |
-0.361/0.315 |
-0.422/0.253 |
-0.365/0.260 |
-0.312/0.251 |
-0.403/0.341 |
-0.382/0.295 |
|
nad6 |
-0.532/0.636 |
-0.551/0.644 |
-0.506/0.485 |
-0.580/0.684 |
-0.575/0.603 |
-0.553/0.671 |
-0.554/0.634 |
-0.469/0.375 |
-0.572/0.635 |
-0.557/0.733 |
|
cob
|
-0.395/0.288 |
-0.482/0.360 |
-0.445/0.333 |
-0.406/0.399 |
-0.506/0.541 |
-0.563/0.465 |
-0.442/0.390 |
-0.364/0.289 |
-0.395/0.373 |
-0.443/0.369 |
|
cox3 |
-0.370/0.368 |
-0.396/0.480 |
-0.393/0.390 |
-0.384/0.464 |
-0.478/0.463 |
-0.449/0.533 |
-0.345/0.407 |
-0.319/0.444 |
-0.401/0.467 |
-0.370/0.384 |
|
nad4l |
-0.577/0.610 |
-0.602/0.574 |
-0.638/0.649 |
-0.539/0.587 |
-0.492/0.684 |
-0.654/0.786 |
-0.627/0.804 |
-0.490/0.619 |
-0.620/0.714 |
-0.622/0.793 |
|
nad1 |
-0.529/0.299 |
-0.541/0.427 |
-0.551/0.447 |
-0.575/0.494 |
-0.479/0.407 |
-0.612/0.494 |
-0.557/0.481 |
-0.440/0.327 |
-0.530/0.427 |
-0.604/0.548 |
|
atp6 |
-0.498/0.389 |
-0.498/0.426 |
-0.503/0.545 |
-0.479/0.429 |
-0.376/0.388 |
-0.620/0.507 |
-0.455/0.438 |
-0.459/0.281 |
-0.559/0.503 |
-0.507/0.490 |
|
cox2 |
-0.360/0.330 |
-0.356/0.369 |
-0.332/0.462 |
-0.420/0.401 |
-0.351/0.302 |
-0.427/0.458 |
-0.293/0.347 |
-0.308/0.352 |
-0.309/0.362 |
-0.340/0.406 |
|
nad3 |
-0.541/0.714 |
-0.598/0.590 |
-0.598/0.667 |
-0.552/0.462 |
-0.560/0.742 |
-0.565/0.641 |
-0.418/0.586 |
-0.456/0.455 |
-0.390/0.656 |
-0.437/0.544 |
|
nad5 |
-0.558/0.422 |
-0.609/0.500 |
-0.556/0.482 |
-0.475/0.451 |
-0.526/0.590 |
-0.620/0.478 |
-0.530/0.525 |
-0.390/0.373 |
-0.560/0.523 |
-0.576/0.562 |
|
nad2 |
-0.538/0.574 |
-0.590/0.600 |
-0.541/0.606 |
-0.429/0.365 |
-0.556/0.550 |
-0.590/0.542 |
-0.549/0.663 |
-0.403/0.269 |
-0.572/0.623 |
-0.577/0.671 |
|
nad4 |
-0.521/0.415 |
-0.597/0.495 |
-0.546/0.460 |
-0.513/0.447 |
-0.593/0.488 |
-0.575/0.465 |
-0.516/0.505 |
-0.446/0.378 |
-0.548/0.526 |
-0.558/0.529 |
|
PCGs |
-0.474/0.378 |
-0.519/0.441 |
-0.486/0.435 |
-0.459/0.418 |
-0.486/0.468 |
-0.547/0.460 |
-0.464/0.445 |
-0.390/0.334 |
-0.485/0.466 |
-0.494/0.477 |
|
complete mt genome |
-0.429/0.375 |
-0.460/0.433 |
-0.433/0.431 |
-0.399/0.420 |
-0.322/0.438 |
-0.483/0.459 |
-0.413/0.448 |
-0.337/0.354 |
-0.419/0.471 |
-0.422/0.470 |
Table 5.Nucleotide codon usage for 12 protein-coding genes of the mitochondrial genome of Mastophorus muris
Table 5.
|
AmAcid |
Codon |
Number |
% |
AmAcid |
Codon |
Number |
% |
AmAcid |
Codon |
Number |
% |
|
Ala |
GCG |
9 |
0.3 |
Lys |
AAG |
70 |
2.0 |
Ser |
AGG |
22 |
0.6 |
|
Ala |
GCA |
5 |
0.1 |
Leu |
TTG |
295 |
8.5 |
Ser |
AGA |
29 |
0.8 |
|
Ala |
GCT |
78 |
2.3 |
Leu |
TTA |
159 |
4.6 |
Ser |
AGT |
106 |
3.1 |
|
Ala |
GCC |
2 |
0.1 |
Leu |
CTG |
7 |
0.2 |
Ser |
AGC |
5 |
0.1 |
|
Cys |
TGT |
85 |
2.5 |
Leu |
CTA |
5 |
0.1 |
Ser |
TCG |
6 |
0.2 |
|
Cys |
TGC |
4 |
0.1 |
Leu |
CTT |
28 |
0.8 |
Ser |
TCA |
8 |
0.2 |
|
Asp |
GAT |
72 |
2.1 |
Leu |
CTC |
1 |
0.03 |
Ser |
TCT |
150 |
4.3 |
|
Asp |
GAC |
1 |
0.03 |
Met |
ATG |
92 |
2.7 |
Ser |
TCC |
1 |
0.03 |
|
Glu |
GAG |
43 |
1.2 |
Asn |
AAA |
13 |
0.4 |
Thr |
ACG |
4 |
0.1 |
|
Glu |
GAA |
28 |
0.8 |
Asn |
AAT |
90 |
2.6 |
Thr |
ACA |
2 |
0.1 |
|
Phe |
TTT |
565 |
16.3 |
Asn |
AAC |
6 |
0.2 |
Thr |
ACT |
94 |
2.7 |
|
Phe |
TTC |
5 |
0.1 |
Pro |
CCG |
4 |
0.1 |
Thr |
ACC |
1 |
0.03 |
|
Gly |
GGG |
44 |
1.3 |
Pro |
CCA |
2 |
0.1 |
Val |
GTG |
47 |
1.4 |
|
Gly |
GGA |
28 |
0.8 |
Pro |
CCT |
67 |
1.9 |
Val |
GTA |
28 |
0.8 |
|
Gly |
GGT |
167 |
4.8 |
Pro |
CCC |
2 |
0.1 |
Val |
GTT |
233 |
6.7 |
|
Gly |
GGC |
10 |
0.3 |
Gln |
CAG |
38 |
1.1 |
Val |
GTC |
2 |
0.1 |
|
His |
CAT |
56 |
1.6 |
Gln |
CAA |
15 |
0.4 |
Trp |
TGG |
42 |
1.2 |
|
His |
CAC |
0 |
- |
Arg |
CGG |
9 |
0.3 |
Trp |
TGA |
39 |
1.1 |
|
Ile |
ATA |
56 |
1.6 |
Arg |
CGA |
5 |
0.1 |
Tyr |
TAA |
6 |
0.2 |
|
Ile |
ATT |
218 |
6.3 |
Arg |
CGT |
41 |
1.2 |
Tyr |
TAT |
195 |
5.6 |
|
Ile |
ATC |
8 |
0.2 |
Arg |
CGC |
0 |
- |
Tyr |
TAC |
4 |
0.1 |
References
- 1. Lafferty KD, Hathaway SA, Wegmann AS, et al. Stomach nematodes (Mastophorus muris) in rats (Rattus rattus) are associated with coconut (Cocos nucifera) habitat at Palmyra Atoll. J Parasitol 2010;96:16-20. https://doi.org/10.1645/GE-2180.1
- 2. Smith JA, Kinsella JM. Gastric spiruridiasis caused by Mastophorus muris in a captive population of striped possums (Dactylopsila trivirgata). J Zoo Wildl Med 2011;42:357-9. https://doi.org/10.1638/2011-0007.1
- 3. Neupane B, Miller AL, Evans AL, Olsson GE, Höglund J. Seasonal variation of Mastophorus muris (Nematoda: Spirurida) in the water vole Arvicola amphibius from southern Sweden. J Helminthol 2018;94:e6. https://doi.org/10.1017/S0022149X18000937
- 4. da Costa Freitas L, de Andrade Silva BE, Vilela RDV, et al. Morphological and genetic characterization of Didelphonema longispiculata (Nematoda: Spiruroidea) in the black-eared opossum Didelphis marsupialis. J Parasitol 2022;108:627-36. https://doi.org/10.1645/21-59
- 5. Neov B, Vasileva GP, Radoslavov G, et al. Phylogeny of hymenolepidids (Cestoda: Cyclophyllidea) from mammals: sequences of 18S rRNA and COI genes confirm major clades revealed by the 28S rRNA analyses. J Helminthol 2021;95:e23. https://doi.org/10.1017/S0022149X21000110
- 6. Guo A. The complete mitochondrial genome of the tapeworm Cladotaenia vulturi (Cestoda: Paruterinidae): gene arrangement and phylogenetic relationships with other cestodes. Parasit Vectors 2016;9:475. https://doi.org/10.1186/s13071-016-1769-x
- 7. Littlewood DT, Lockyer AE, Webster BL, Johnston DA, Le TH. The complete mitochondrial genomes of Schistosoma haematobium and Schistosoma spindale and the evolutionary history of mitochondrial genome changes among parasitic flatworms. Mol Phylogenet Evol 2006;39:452-67. https://doi.org/10.1016/j.ympev.2005.12.012
- 8. Boore JL, Lavrov DV, Brown WM. Gene translocation links insects and crustaceans. Nature 1998;392:667-8. https://doi.org/10.1038/33577
- 9. Humphreys-Pereira DA, Elling AA. Mitochondrial genomes of Meloidogyne chitwoodi and M. incognita (Nematoda: Tylenchina): comparative analysis, gene order and phylogenetic relationships with other nematodes. Mol Biochem Parasitol 2014;194:20-32. https://doi.org/10.1016/j.molbiopara.2014.04.003
- 10. Kumar V, Pakrashi A, Kalleshwaraswamy CM, Banerjee D, Tyagi K. Gene rearrangement in the mitogenome of whiteflies (Hemiptera: Aleyrodinae) along with their phylogeny and characterization of complete mitogenome of Aleurodicus rugioperculatus. Mol Biol Rep 2022;49:4399-409. https://doi.org/10.1007/s11033-022-07275-7
- 11. Wu Y, Yang H, Feng Z, et al. Novel gene rearrangement in the mitochondrial genome of Pachyneuron aphidis (Hymenoptera: Pteromalidae). Int J Biol Macromol 2020;149:1207-12. https://doi.org/10.1016/j.ijbiomac.2020.01.308
- 12. Shao Y, Zhou L, Li F, et al. Phylogenomic analyses provide insights into primate evolution. Science 2023;380:913-24. https://doi.org/10.1126/science.abn6919
- 13. Kang H, Li B, Ma X, Xu Y. Evolutionary progression of mitochondrial gene rearrangements and phylogenetic relationships in Strigidae (Strigiformes). Gene 2018;674:8-14. https://doi.org/10.1016/j.gene.2018.06.066
- 14. Dierckxsens N, Mardulyn P, Smits G. NOVOPlasty: de novo assembly of organelle genomes from whole genome data. Nucleic Acids Res 2017;45:e18. https://doi.org/10.1093/nar/gkw955
- 15. Bernt M, Donath A, Jühling F, et al. MITOS: improved de novo metazoan mitochondrial genome annotation. Mol Phylogenet Evol 2013;69:313-9. https://doi.org/10.1016/j.ympev.2012.08.023
- 16. Chan PP, Lin BY, Mak AJ, Lowe TM. tRNAscan-SE 2.0: improved detection and functional classification of transfer RNA genes. Nucleic Acids Res 2021;49:9077-96. https://doi.org/10.1093/nar/gkab688
- 17. Lagesen K, Hallin P, Rødland EA, et al. RNAmmer: consistent and rapid annotation of ribosomal RNA genes. Nucleic Acids Res 2007;35:3100-8. https://doi.org/10.1093/nar/gkm160
- 18. Kohli DK, Bachhawat AK. CLOURE: Clustal Output Reformatter, a program for reformatting ClustalX/ClustalW outputs for SNP analysis and molecular systematics. Nucleic Acids Res 2003;31:3501-2. https://doi.org/10.1093/nar/gkg502
- 19. Kumar S, Stecher G, Li M, Knyaz C, Tamura K. MEGA X: Molecular Evolutionary Genetics Analysis across computing platforms. Mol Biol Evol 2018;35:1547-9. https://doi.org/10.1093/molbev/msy096
- 20. Guo A. Moniezia benedeni and Moniezia expansa are distinct cestode species based on complete mitochondrial genomes. Acta Trop 2017;166:287-92. https://doi.org/10.1016/j.actatropica.2016.11.032
- 21. Perna NT, Kocher TD. Patterns of nucleotide composition at fourfold degenerate sites of animal mitochondrial genomes. J Mol Evol 1995;41:353-8. https://doi.org/10.1007/BF00186547
- 22. Luo L, Xu Y, Wang S, et al. Complete mitochondrial genome sequence and phylogenetic analysis of Procambarus clarkii and Cambaroides dauricus from China. Int J Mol Sci 2023;24:11282. https://doi.org/10.3390/ijms241411282
- 23. Greiner S, Lehwark P, Bock R. OrganellarGenomeDRAW (OGDRAW) version 1.3.1: expanded toolkit for the graphical visualization of organellar genomes. Nucleic Acids Res 2019;47:W59-64. https://doi.org/10.1093/nar/gkz238
- 24. Wang BJ, Gu XB, Yang GY, et al. Mitochondrial genomes of Heterakis gallinae and Heterakis beramporia support that they belong to the infraorder Ascaridomorpha. Infect Genet Evol 2016;40:228-35. https://doi.org/10.1016/j.meegid.2016.03.012
- 25. Lin RQ, Liu GH, Zhang Y, et al. Contracaecum rudolphii B: gene content, arrangement and composition of its complete mitochondrial genome compared with Anisakis simplex s.l. Exp Parasitol 2012;130:135-40. https://doi.org/10.1016/j.exppara.2011.11.003
- 26. Gao JF, Zhao Q, Liu GH, et al. Comparative analyses of the complete mitochondrial genomes of the two ruminant hookworms Bunostomum trigonocephalum and Bunostomum phlebotomum. Gene 2014;541:92-100. https://doi.org/10.1016/j.gene.2014.03.017
- 27. Hu M, Gasser RB, Abs El-Osta YG, Chilton NB. Structure and organization of the mitochondrial genome of the canine heartworm, Dirofilaria immitis. Parasitology 2003;127:37-51. https://doi.org/10.1017/s0031182003003275
- 28. Kang S, Sultana T, Eom KS, et al. The mitochondrial genome sequence of Enterobius vermicularis (Nematoda: Oxyurida): an idiosyncratic gene order and phylogenetic information for chromadorean nematodes. Gene 2009;429:87-97. https://doi.org/10.1016/j.gene.2008.09.011
- 29. Liu GH, Zhou DH, Zhao L, et al. The complete mitochondrial genome of Toxascaris leonina: comparison with other closely related species and phylogenetic implications. Infect Genet Evol 2014;21:329-33. https://doi.org/10.1016/j.meegid.2013.11.022
- 30. Tian P, Wang W, Xu Z, et al. The complete mitochondrial genome of Homophyllia bowerbanki (Scleractinia, Lobophylliidae): the first sequence for the genus Homophyllia. Genes (Basel) 2023;14:695. https://doi.org/10.3390/genes14030695
- 31. Tyagi K, Kumar V, Poddar N, et al. The gene arrangement and phylogeny using mitochondrial genomes in spiders (Arachnida: Araneae). Int J Biol Macromol 2020;146:488-96. https://doi.org/10.1016/j.ijbiomac.2020.01.014
- 32. Wolstenholme DR. Animal mitochondrial DNA: structure and evolution. Int Rev Cytol 1992;141:173-216. https://doi.org/10.1016/s0074-7696(08)62066-5
- 33. Yatawara L, Wickramasinghe S, Rajapakse RP, Agatsuma T. The complete mitochondrial genome of Setaria digitata (Nematoda: Filarioidea): mitochondrial gene content, arrangement and composition compared with other nematodes. Mol Biochem Parasitol 2010;173:32-8. https://doi.org/10.1016/j.molbiopara.2010.05.004
- 34. Kim KH, Eom KS, Park JK. The complete mitochondrial genome of Anisakis simplex (Ascaridida: Nematoda) and phylogenetic implications. Int J Parasitol 2006;36:319-28. https://doi.org/10.1016/j.ijpara.2005.10.004
- 35. Keddie EM, Higazi T, Unnasch TR. The mitochondrial genome of Onchocerca volvulus: sequence, structure and phylogenetic analysis. Mol Biochem Parasitol 1998;95:111-27. https://doi.org/10.1016/s0166-6851(98)00102-9